Digital Power Debug
Introduction to the Powerstick System
A picture speaks a thousand words, so let’s just cut to the chase and look at the hardware and software we will be using.
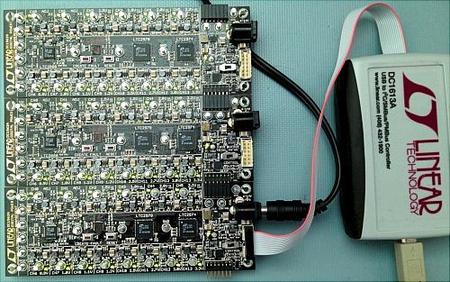
Figure 1. Powerstick and PMBus Host Controller.
Above you can see three Powersticks, each with 14 rails, and one green LED per rail to indicate power. On the bottom right is a 12V DC input, and a DC1613A PMBus Controller that is connected to a Windows PC.
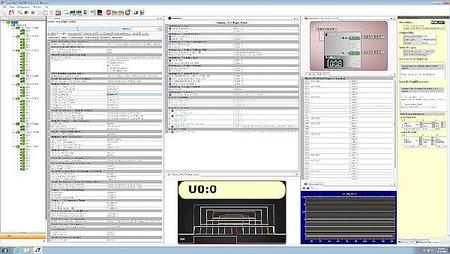
Figure 2. LTpowerPlay.
Above you can see the LTpowerPlay™ software, which uses the PMBus Controller to communicate with all the PMBus targets. This GUI easily handles all 42 rails of the system shown in Figure 2.
Now let’s take a closer look at what is on each Powerstick.
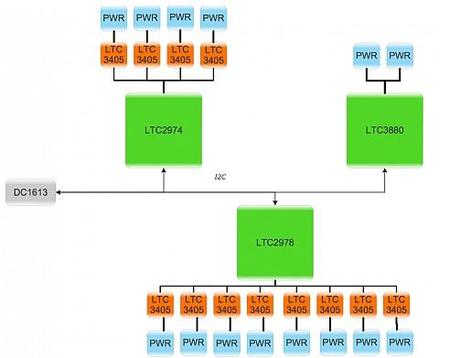
Figure 3. Powerstick Block Diagram.
There are three PMBus devices on the Powerstick:
- LTC3880 Dual Output PolyPhase Step-Down DC/DC Controller with Digital Power System Management
- LTC2974 Quad Digital Power Supply Manager with EEPROM
- LTC2978 Octal Digital Power Supply Manager with EEPROM
The Digital Power Supply Managers are controlling and monitoring 12 LTC3405 Buck Switching Regulators. The final 2 outputs come directly from the LTC3880.
Introduction to LTpowerPlay™
Now that we have a playground with 42 rails, let’s dig into the basics of the tool so there is some context for debug examples.
The GUI is organized into several views:
System Tree – Configuration – Telemetry – Visualizer – Help
System Tree
The Tree shows each chip, and under each chip is a list of rails.
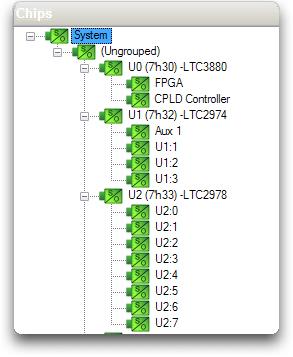
Figure 4. System Tree.
You can see rails from one of the Powersticks. Each chip displays its address and type. Each rail has a name, which you can change, much like naming channels on a scope. This makes it easier to keep track of the rails by naming them to match your schematic.
When you press on any node, the other columns adjust their contents to match the context of the node selected, simplifying navigation of the large system.
Configuration
The configuration column shows PMBus settings for a rail.

Figure 5. Configuration.
Many of the settings directly correspond to the PMBus specification. Many are manufacturer specific. You can change any setting and send it by PMBus to a chip to change its behavior, by pressing a send button on the toolbar.
Telemetry
The telemetry view displays all the values the chips are monitoring, the state of the supervisors and fault status.
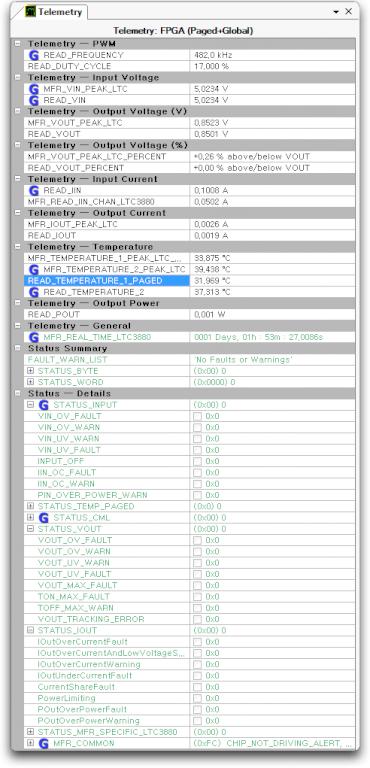
Figure 6. Telemetry.
You can see the status of Input Voltage, Output Voltage, Output Current, and Faults. This display is updated real time.
System Visualizer
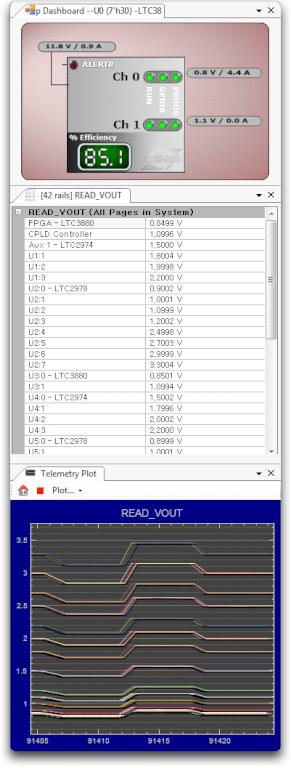
Figure 7. Visualizer.
The System Visualizer provides three views: Dashboard, Filtered Data, and Telemetry.
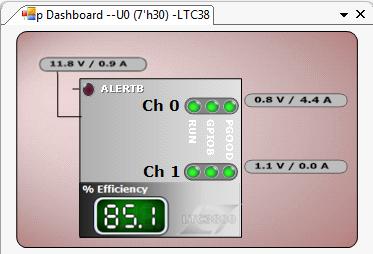
Figure 8. Dashboard.
The Dashboard reports the live status of the inputs, outputs, and efficiency. In this particular case Channel 0 and 1 are on with good power. The efficiency is 85.1% under a light 4.4A load.
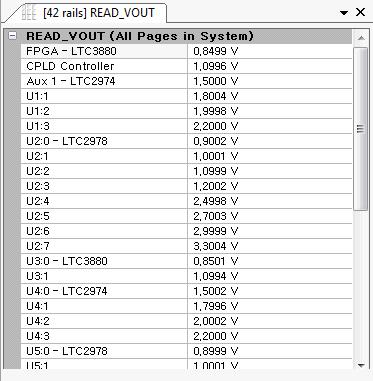
Figure 9. Data Filter.
The Filtered Data view is a context sensitive display of common data. By selecting VOUT, all the rails are displayed. This offers a quick way to view and edit common data.
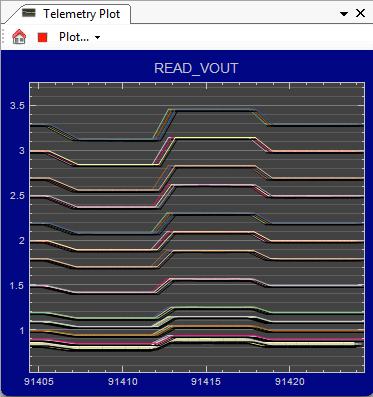
Figure 10. Telemetry.
The Telemetry View shows live updates. Like the Filtered Data View, it is context sensitive. By selecting VOUT, all of the rails of the system are displayed. In this case, the outputs were margined low, then margined high, then returned to their nominal values.
Help
The final column is a help column. It just explains the functionality of a setting, PMBus command correlate, and how to program the register with code. If a selected rail is off, this view also provides ‘live’ contextual debug analysis to help isolate root cause.
Debugging
Now that you have a general idea of the hardware and software, let’s look at some simple debug scenarios.
Brand New Hardware
Suppose you have your first board. Your configurations are already generated, perhaps by another engineer. Should you just power up the board and hope for the best?
I wouldn’t do that. I would at least take a look at a few things to make sure you don’t have a disaster on your hands. You know what they say about assumptions…
Above, you saw the dashboard with the rail voltages. I would check those first to make sure they match the design. This will at least ensure you don’t blow your hardware up, or worse, wound it.
Then I would look at the overall power sequencing.

Figure 11. Idealized Waveforms.
You can see here all the rails and when they turn on and off. You can select each rail one by one from the tree.
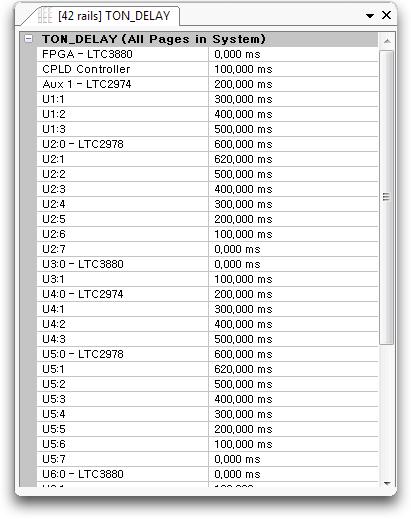
Figure 12. Delays.
If you prefer, you can look at the timing in a table. Here you can see all the delays. Note that this is using time based sequencing, not event based sequencing, as mentioned in a previous post. You can see how easy it is to change the order rails turn on and off. You can just edit the table. No hardware or PMBus Host firmware changes are required. No mucking around with code or Verilog. However, if you have a good reason to control things by PMBus, I’ll show you how to do that too, in a future blog.

Figure 13. Faults.
You may also want to look at the fault settings. In this example, an over current causes the output to turn off, with a retry. However, the current is de-glitched to prevent small transients from tripping the fault.
You may also want to make sure the fault propagates to the fault pin, and make sure that when the fault pin is pulled low from another rail, you also power down the output. In general, it is much safer for all faults to be enabled, to communicate to their neighbors, and for everyone to power down if there is a fault in the neighborhood. Especially when you bring up the rails the very first time.
You could also turn off all rails from the beginning and add them a few at a time to limit the scope of your debugging, but we are just going to be bold and fire when ready.
First Power Up
So now you power up the first time and… you get a fault. Your status lights are blinking because the rails fail to power up, and they are retrying over and over.
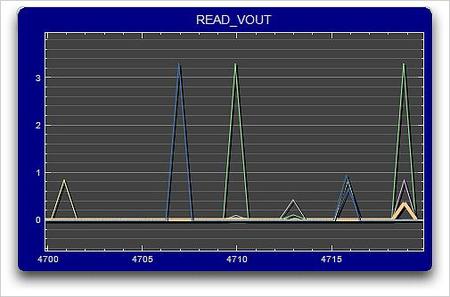
Figure 14. Motorboating.
Your telemetry shows the rails attempting to turn on and then immediately turn off.
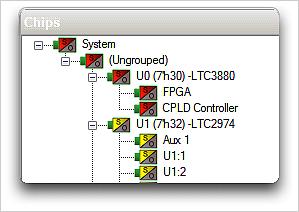
Figure 15. Faults in Tree.
You can see a red node in the tree indicating a fault on the FPGA rail, and grey nodes indicating rails that are off.
You could go get a scope, or look at the fault with LTpowerPlay™. However, by selecting the rail, you can see the fault register.

Figure 16. Status.
You can see the fault is an over voltage threshold. So now you go check the settings.

Figure 17. Output Settings.
Wow, you set the output over voltage supervisor threshold lower than the output voltage set point. So you fix that, and the problem is solved.
Note: The software tool actually makes it easy to avoid these common mistakes in the first place, but then I would not have a debug example.
Rail Goes Down While Working on System
So, now your rails are up, and while you are working on the system, the power drops out and returns, causing your system to reset. What happened?
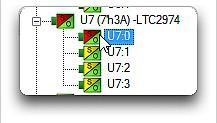
Figure 18. Faulted Rail.
We see that rail U7:0 has a fault and select it.

Figure 19. Under-voltage Fault.
We see that this rail failed from under voltage. The rail is still powered because all the rails are set to retry. The system basically reset itself. Unfortunately, you now have to do some work and figure out why this happened, but at least you know exactly where to look.
Imagine what you would have to do without PMBus and LTpowerPlay™. You would have to put a scope on every rail in the system and try to duplicate the fault. With LTpowerPlay™, you just plug-in, and see the problem immediately.
I don’t know about your scope, but mine does not have 42 channels, nor does my scope keep track of peaks over long periods of time, nor will it show a fault if the fault occurred before connecting the probes. LTpowerPlay™ can be connected after a fault occurs, and then used to debug it. You don’t have to regenerate the fault to find out where it occurred.
Summary
Debugging a system with lots of rails is not hard if it is controlled by PMBus, and you have good software tools. The best tools give you a system level view of all the rails, their settings, telemetry, and faults. They also help you narrow down the location and cause of the fault quickly.
In my last post I indicated several things one should look for in PMBus devices. One item was a good configuration and debug tool. This is just as important as all the hardware mechanisms, because it makes the whole system play.
System level tools bring PMBus to life by presenting data in an organized way that makes it easier to configure, monitor, and diagnose faults. Manufacturers also add MFR PMBus commands that enhance the end user experience beyond standard PMBus commands. I’ll cover some of these advanced features in future posts.


