製品概要

機能と利点

  • デバイス設定ブロック(DCB)
  • VSMスイート・ライブラリ設定(LCFG)
  • ロー・タッチ機能

製品概要

このユーザ・ガイドでは、データのストリーミングやログ記録のためにStudy Watch 4.5をユニバーサル・シリアル・バス(USB)またはBluetooth Low Energy(BLE)経由でMicrosoft Windowsコンピュータに接続する手順、およびApplication Wavetoolソフトウェアを使用してバイタル・サイン・データを分析する手順について説明します。

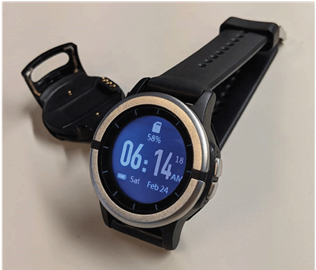
Study Watch 4.5は、アナログ・デバイセズのバイタル・サイン監視用の生物医学センサーとアルゴリズムの機能を示すために設計された製品です。

Study Watch 4.5はバッテリ駆動のウェアラブル・デバイスで、フォトプレチスモグラフィ(PPG)、心電図(ECG、生体電位を使用)、皮膚電気活動(EDA、生体インピーダンスを使用)、皮膚温度、および動作/活動(3軸加速度センサーを使用)の継続的なモニタリングおよびオンデマンドのスポット・チェック計測が可能です。生のセンサー・データが、ウォッチに組み込まれたアルゴリズムによって解析され、心拍数(HR)、酸素飽和度(SpO2)、呼吸数(RR)などのバイタル・サインをリアルタイムで取得できます。

ソフトウェア

評価用ソフトウェア

EVAL-STUDYWATCH45Z Python SDK
Python SDK empowers developers to seamlessly integrate and interact with the ADI Study Watch 4.5. Whether connecting via USB or Bluetooth Low Energy (BLE), it enables robust communication with the device—allowing applications to send and receive data packets, decode sensor outputs, and access onboard algorithms and file systems. Designed to streamline development, the SDK simplifies the creation of custom health, fitness, and research applications, accelerating innovation on the Study Watch platform.
EXE
28.32 M
EVAL-STUDYWATCH45Z Application Wavetool
Application Wavetool is a robust Windows-based GUI designed to accelerate the development and testing of wearable health technologies. It offers real-time streaming, visualization, and logging of vital signs including PPG, SpO₂, heart rate, ECG, EDA, temperature, and motion. With advanced sensor configuration, seamless USB/BLE connectivity, and comprehensive support for multiple vital signs monitoring (VSM) use cases, Wavetool empowers engineers and developers to perform in-depth sensor analysis and validate algorithms with precision and efficiency.
APK
32.98 M
EVAL-STUDYWATCH45Z Android Application
The Android App is a powerful companion for the Study Watch 4.5, enabling seamless real-time health data streaming and device management via Bluetooth Low Energy (BLE). Tailored for researchers, clinicians, and health enthusiasts, the app features intuitive dashboards and interactive graphs to visualize vital signs such as PPG, ECG, EDA, heart rate, SpO₂, respiratory rate, temperature, and accelerometer data. Users can effortlessly start or stop data logging, download stored logs for offline analysis, and configure essential device settings—all from a user-friendly mobile interface.