High-Performance Computing with Low-Cost Microcontrollers
Abstract
More than ever, microcontrollers (µCs) include DSP-like functions, in addition to more conventional ALU cores. Unfortunately, many firmware developers, unfamiliar with DSP algorithms and coding techniques, fail to take full advantage of the capabilities offered in these devices. This article is a firmware developer’s primer for the use of signal-processing techniques in low-cost µCs.
The Changing Role of Microcontrollers
It was not so long ago that designing with a µC meant a multitude of peripheral and support chips surrounding the CPU itself. Even if the CPU had sufficient embedded ROM and RAM, any non-trivial project would require functions provided by external support chips. This was never more true than when the system involved analog signals of any kind. Introduce even the simplest analog-signal requirement, and system complexity would balloon. But, that is the problem—the real world of sounds, temperatures, pressures, and other natural phenomena remains persistently analog. In actuality, a system capable of operating in the analog world requires:
- A transducer and analog analog-signal conditioner to translate the physical phenomenon to an electrical signal
- A data-acquisition subsystem that would, at a minimum, consist of an analog-to-digital converter (ADC) and a digital-to-analog converter (DAC) of sufficient accuracy and speed
- A digital-signal processor (DSP) capable of processing the sampled data
- A µC with enough throughput to manage the DSP, the data-acquisition subsystem, and other peripherals, and with enough remaining bandwidth left to smoothly execute control and user-interface functions; the µC may also possibly contain program ROM and data RAM
An example of the new generation of µC is the MAXQ3120. In addition to the usual array of UARTs, timers, and I/O ports, the MAXQ3120 integrates a set of peripherals that make analog interfacing easy:
- A 16-bit, 1-cycle RISC core
- A pair of 16-bit, sigma-delta ADCs
- A 16-bit timer capable of operating in PWM mode
- A 16 x 16 multiplier with a 40-bit accumulator
Modern µCs integrate most of the necessary system functions within the device, including analog peripherals and a MAC.
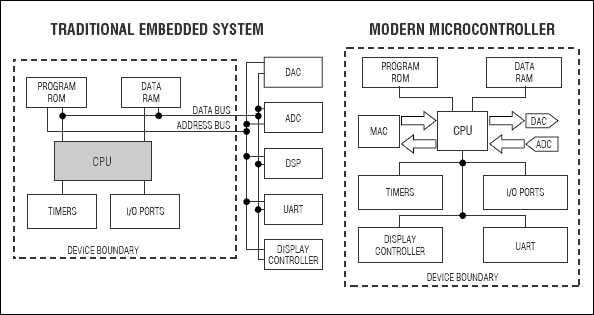
Figure 1. A traditional embedded system must expose an address and data bus for the attachment of external I/O devices to complete the system.
Thinking about the Problem
Problems that involve signal processing are best approached in three phases:
- What do you want to do? Carefully dissect the problem and break it into the smallest functional units possible. Does the problem involve filtering, signal discrimination, or generation of a particular type of signal? When you have divided the problem into a series of simpler subtasks, you are ready for the next step.
- How do you do it? Now search the literature, the web, or other resources to find the algorithms that pertain to each task. You will likely find that most of your conceptual problems have been solved already. All you have to do is the last step.
- Code it. The task of converting the algorithms into code is a familiar one, and the hardware resources available make it easier than ever.
Power Monitoring and Measurement Example
One common example of analog-to-µC interfacing is measuring the voltage and current of an AC circuit to determine the power consumed by a load. At first, this seems relatively straightforward—if the voltage and current waveforms are sinusoidal, the RMS voltage and current are just 1/ times the peak voltage or current. Multiply the RMS voltage and current together, and the result is power in watts. What could be simpler?
There are two problems with this analysis. First, while the voltage delivered from the a power company is often very nearly sinusoidal, the current waveform is not. Lamp dimmers, switching power supplies, and fluorescent lighting all present a nonsinusoidal current profile to the power line. Simple multiplication by a constant will not give the RMS current value. Second, even if the current waveform is sinusoidal, unless the voltage and current waveforms are precisely in phase, simple multiplication of the RMS values does not provide the actual power usage in watts. In general, real-world loads contain either capacitive or, more often, inductive reactance. Therefore, reactive power must be considered. We must return to fundamentals to find a better way.
At each instant in time, the product of instantaneous voltage and current is instantaneous power. Figure 2 illustrates how this instantaneous power rises and falls, and may even dip below zero for part of the cycle, depending on the current flow. The total real power is simply the time average of the product of instantaneous voltage and instantaneous current. Finding the real power is simple— multiply the voltage sample and the current sample, and add the result to an accumulator. After a sufficient number of samples have been accumulated, just divide the sum by the number of samples to obtain the power in watts. To convert this to energy in watt-seconds, multiply by the time in seconds over which the samples were accumulated.

Figure 2. While the voltage waveform (dashed line) is often very nearly sinusoidal, the current waveform (solid line) may vary significantly from a pure sinusoid. Additionally, the current waveform may be shifted in phase, causing instantaneous power (dotted line) at some parts of the line cycle to become negative.
Calculation of reactive power is not as straightforward. First, note that, for sinusoidal voltage and current, the reactive power is defined as:

where V is the RMS voltage, I is the RMS current, and  is the phase difference between the current and voltage waveforms.
The power due to reactive components can be determined at any time by calculating a difference:

and

where Vt and It are the instantaneous values for voltage and current at any time,  is any arbitrary delay, and T is the period of one line cycle. The difference is:

Using the trigonometric identities cos(A+B) = cosAcosB - sinAsinB and cos(A-B) = cosAcosB + sinAsinB changes the equation to:

Note that the cosine terms cancel and the sine terms reinforce, leaving only:

But VI sin() is Q, and that is what we are trying to find. So, rearranging the terms leaves:

This means that the reactive power can be calculated by accumulating the difference between the product of the most recent current sample and the previous voltage sample, and the most recent voltage sample and the previous current sample. The denominator in the above formula is a constant if is set to the sample period, so it can be precalculated.
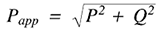
Once the real power and reactive power are known, the apparent power (the power that would be calculated if the RMS voltage and power were multiplied) can be easily calculated as:
Finally, the power factor is found by dividing the real power by the apparent power.
Assuming, for the moment, that tracking of all of these factors is desirable, an application would need to keep track of the sum of the product of the voltage channel and the current channel, and the sum of the product differences described in the previous discussion on reactive power. The code for accumulating real power would look like:
void accumulateRealPower(int i_sample, int
v_sample)
{
static long real_power;
initMAC(MULTIPLY_ADD);
preloadMAC(real_power);
real_power = getMAC(v_sample,
i_sample);
}
In this example, the
initMAC function takes a byte that sets operational parameters in the MAC. The preloadMAC function loads a long variable into the accumulator prior to the multiply operation.
To demonstrate how this can translate into actual machine instructions, consider the following set of operations based on the above code:
- Initialize the multiply-accumulate unit, or MAC (one cycle)
- Set the memory pointer to sum the storage area (one cycle)
- Load the old sum into the accumulator (two cycles)
- Load the voltage sample into the multiplier (one cycle)
- Load the current sample into the multiplier (one cycle)
- Wait one cycle for the accumulate operation to complete (one cycle)
- Save the accumulator to memory (one cycle)
void accumulateReactivePower(int i_sample, int
v_sample)
{
static long reactive_power;
initMAC(MULTIPLY_ADD);
preloadMAC(reactive_power);
reactive_power = getMAC(prev_v_sample,
i_sample);
initMAC(MULTIPLY_SUB);
reactive_power = getMAC(prev_i_sample,
v_sample);
}
Note that this discussion assumes that the input samples have zero DC offset. If this is not true, it will be necessary to provide additional accumulators for the voltage and current channels by themselves. If there is zero DC offset, these sums will be zero. If not, the power represented by the DC offset must be subtracted from the accumulated real power.
Filtering Example
Filtering is one of the most common tasks to be performed in the digital realm. The reason is simple—ideal filters, unrealizable in the analog world, are relatively simple to implement in digital logic.
In this section, a lowpass filter and a bandpass filter are presented. Lowpass filters are commonly used to remove unwanted, high-frequency components from a signal prior to sampling for elimination of aliasing artifacts. Bandpass filters are often used to restrict a communication channel to a particular range of frequencies. An FSK modem may, for example, use a bandpass filter to eliminate both high and low-frequency noise components, leaving only the frequencies of interest to be processed.
Volumes have been written on the topic of digital filters, possibly leading one to believe that the topic is difficult to fathom. In reality, the basics are simple, and one need not be a DSP expert to make use of filtering functions.
By inspecting the lowpass filter diagram in Figure 3, it can be seen that:

where Yn is the current output sample, Yn-1 is the previous output sample, and Xn is the current input sample. The filter constant, b0, is precalculated to be:

where f0 is the desired half-amplitude corner frequency, and is the sample period. Therefore, for a sample rate of 8kHz and a desired corner frequency of 100Hz, b0 would be equal to p x 125µs x 100Hz = 3.93 x 10⁻²

Figure 3. A single-pole, lowpass filter is used prior to signaling to remove unwanted high-frequency components from a signal.
Implementing the filter algorithm is quite simple:
long lpf(int input_sample)
{
static long prev_out;
initMAC(MULTIPLY_SUB);
preloadMAC(prev_out);
prev_out = getMAC(b0, prev_out);
initMAC(MULTIPLY_ADD | ONE_OP);
prev_out = oneopMAC(input_sample);
return prev_out;
}
The
oneopMAC function loads only one operand into the multiplier, expecting the multiplier to maintain the second operand. This is done to save execution time. This filter, if efficiently compiled, requires only ten cycles per sample. With an 8MHz clock, this means that a 1st-order lowpass filter would only consume about 1% of the MAXQ3120’s processing bandwidth (without considering interrupt overhead.)A 2nd-order bandpass filter is conceptually somewhat more complex, though practically similar, adding only a few steps to the algorithm. The signal-flow diagram for a simple, 2nd-order bandpass filter is shown in Figure 4,and its formula is:


Figure 4. A 2nd-order bandpass filter can restrict a communication channel to a particular range of frequencies.
As in the previous example, the parameters b0, a1, and a2 are precalculated. The a1 parameter defines the Q-factor of the filter—a measure of how effectively the filter rejects of out-of-band frequencies near the center frequency. Specifically,
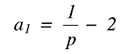
with p typically in the range of 100 to 1,000. Larger values of p represent narrower passband, but longer filter settling times. Smaller values of p provide a wider passband and faster settling times.
The other parameters, a2 and b0, are calculated in terms of a1. First, we define two intermediate variables:

Now we can define the other two parameters:

Note that once the center frequency, the sampling rate, and the filter Q-factor are selected, the parameters are constants. The necessary code is:
long bpf(int input_sample)
{
static long x[1], y[1], output;
initMAC(MULTIPLY_ADD | CLEAR_ACC);
output = getMAC(y[1], a2);
initMAC(MULTIPLY_SUB);
}

output = getMAC(y[0], a1);
output = getMAC(x[1], b0);
initMAC(MULTIPLY_ADD | ONE_OP);
output = oneopMAC(input_sample);
x[1] = x[0];
x[0] = input_sample;
y[1] = y[0];
y[0] = output;
return output;
}
This routine (exclusive of aging of the input and output samples) requires fourteen cycles, if efficiently compiled. Aging is not included in the cycle estimate as the samples will often be stored in a circular buffer, requiring no aging.
Tone Generation and Detection Example
In communications applications, it is often necessary to generate/detect combinations of tones in an audio channel. In telephone applications, for example, it is not uncommon to want to synthesize or detect dual-tone multifrequency tones (DTMF) in a telephone line for dialing on a telephone line. In trunk cards, standard multifrequency (MF) tones are often used for in-band signaling. Call-progress signaling (dial tone, ringback, busy, and reorder, among others) is often presented as a combination of two or more tones.
A two-pole digital resonator (Figure 5) is a simple way of generating tones. The formula for the resonator is:

where k is:

and can be precalculated. Note that there is no input to this resonator—it operates continuously without intervention. To start the resonator, however, Yn-1 must be set to zero and Yn-2 set to -Asink, where A is the desired amplitude of the signal.

Figure 5. A two-pole digital resonator is used for sine-wave generation.
The algorithm to produce a sine wave is the simplest presented so far:
long gen_tone_sample()
{
static long y[1];
initMAC(MULTIPLY_ADD);
preloadMAC(-y[1]);
y[1] = y[0];
y[0] = getMAC(y[0], k);
return y[0];
}
The estimate of code size for this routine is about eight machine cycles per sample of sine wave to be generated. This has similar CPU intensity to generating a simple square wave, which must then be filtered by external analog circuitry to produce the spectral purity that many applications require.
Tone detection is somewhat more complicated, though not that daunting when pared to the essentials. To detect a tone in an audio channel, we select the Goertzel algorithm. This algorithm utilizes a 2nd-order filter and a power-measurement formula to determine the presence of energy in the filter passband.
The formula for the 2nd-order filter in Figure 6 is:

where k is defined the same as in the tone generator described previously. The algorithm is:
long *tone_filter(int input_sample)
{
static long y[1], output;
initMAC(MULTIPLY_ADD);
preloadMAC(-y[1]);
y[1] = y[0];
y[0] = getMAC(y[0], k) +
input_sample;
return y;
}
Notice that this routine returns an array rather than a scalar value. This is because the next step needs both the most recent result and the previous result. The estimate for the cycle count for one tone-detector channel is 12 cycles, or, at a sampling rate of 8kHz, about 1.5% of the CPU horsepower. In general, it will require more than 100 sample periods before the filter settles and provides a reliable indication of tone presence.

Figure 6. Tone detection can be performed by a 2nd-order filter.
To test for the presence of a tone, it is necessary to calculate the power in the filtered signal. This can be done using the following equation:

Because the coefficient is the same as that precalculated for the filter loop, we can use it here to calculate the power:
power_squared = y[0] * y[0] +
                y[1] * y[1] -
                k * y[0] * y[1];
After a sufficient number of sample periods, tone presence is shown by a squared power indication that will be at least one order of magnitude above the measurement in the absence of a tone. In tests, presence of a tone might demonstrate a squared amplitude of more than 1,000 with unity-signal amplitude at the input. An off-frequency tone, or a combination of off-frequency tones, would typically demonstrate a squared amplitude of less than 50.
Conclusion
As data-acquisition hardware and DSP-like building blocks become more common on inexpensive µCs, firmware engineers must find ways to pull DSP functions into the main CPU to reduce cost and improve performance. With the wealth of resources available in literature and on the web, however, this task is much easier than expected.
About the Authors
Related to this Article
Product Categories