Overview
Design Resources
Design & Integration File
- Schematic
- Bill of Materials
- Gerber Files
- PADS Files
- Assembly Drawing
Evaluation Hardware
Part Numbers with "Z" indicate RoHS Compliance. Boards checked are needed to evaluate this circuit.
- EV-ADUCRF101QS3Z ($140.06) ADUCRF101 Quick Start Eval Kit
Features & Benefits
- Complete Anemometer Signal Conditioning
- Wireless ISM Transceiver
- On-Chip Microcontroller
Markets and Technologies
Parts Used
Documentation & Resources
Circuit Function & Benefits
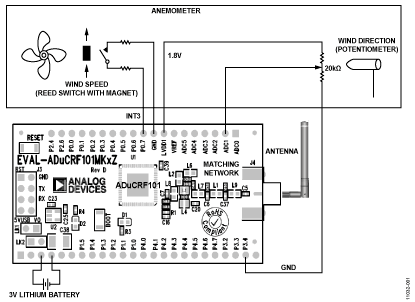
The circuit in Figure 1 is a battery powered precision analog microcontroller circuit with an integrated RF ISM-band transceiver used to transmit wind speed and wind direction from a passive anemometer. In the application shown, the on-chip 12-bit analogto-digital converter (ADC) and the wake-up timers are used to acquire the wind direction and speed, respectively. The low power hibernate mode is used to conserve power, which is important in wireless remote sensing applications. When in hibernation mode, the ADuCRF101 nominally consumes 1.9 μA of supply current, resulting in long battery life. A single CR2032 lithium ion battery can last 1 year to 2 years when operated in this mode.

The ADuCRF101 offers a fully integrated solution for this data acquisition application designed for low power wireless applications. The ADuCRF101 features a 12-bit ADC, a low power Cortex™-M3 core from ARM®, a 431 MHz to 464 MHz and 862 MHz to 928 MHz RF ISM-band transceiver, and Flash/EE memory. This wireless data acquisition system is designed to operate in battery-powered applications where low power is critical. The device can be configured in normal operating mode or various low power sleep modes under direct program control. In flexi mode, any peripheral can operate and wake up the device, and in hibernate mode, the internal wake-up timer remains active. While in shutdown mode, only an external interrupt can wake up the device.
In the application shown in Figure 1, the 12-bit ADC and the wake-up timers are used to acquire the wind direction and speed, respectively. To conserve power, the low power hibernate mode is used. When in hibernate mode, the ADuCRF101 nominally consumes 1.8 µA of supply current, resulting in long battery life. The functionally of the ADuCRF101 and its small 9 mm × 9 mm package size makes it a very easy-to-use and cost-effective solution in this and other wireless data acquisition applications.
Circuit Description
The circuit in Figure 1 contains an EV-ADuCRF101MK3Z evaluation board which includes the ADuCRF101, a fully integrated wireless data acquisition solution. The function of the ADuCRF101 is to collect wind speed and direction information from an anemometer, and to transmit this information wirelessly to another ADuCRF101 that is in receive mode.
The EV-ADuCRF101MK3Z has been optimized for use in the 431 MHz to 464 MHz ISM band. This evaluation board allows for easy access to the ADuCRF101 via through-holes on the edge of the board. More information on the EV-ADuCRF101MK3Z is available in the UG-231 User Guide. In this application, the evaluation board is interfaced to an anemometer. The anemometer can be connected via cables or through an adapter board, see Figure 1. A 3 V lithium CR2032 battery is used to power the evaluation board.
The wind speed section of a typical passive anemometer is made of a reed switch that is toggled on and off as a magnet passes over it. The magnet is attached to the bearing of the anemometer’s fan; therefore, as the wind spins the fan, the magnet periodically moves past the switch toggling it each time. The switch is connected between the GND pin and P0.7 of the printed circuit board (PCB). A single revolution of the fan toggles the switch once and thus generates a pulse on P0.7 that is used as an interrupt signal. In this example, P0.7 is assigned IRQ3. The time between two pulses is used to calculate the wind speed. The 32-bit wake-up timer is used. This timer uses the 32 kHz LFOSC clock internal to the ADuCRF101 and a prescaler divisor of 1. The primary reason for using the wake-up timer is because it is active during hibernate mode while the general-purpose timers are not. Therefore, the interrupt timing is continuous even when the part is in a low power sleep mode.
The wind direction section of a passive anemometer is typically made of a potentiometer connected to a wind vain. As the direction of the wind vane changes so does the value of the potentiometer. The wiper of the potentiometer is connected to the ADC1 pin, and the other two connections of the potentiometer go to the low voltage 1.8 V LDO LVDD1 pin and the P3.4 pin. Connecting to the P3.4 pin instead of directly to ground enables the option for P3.4 to be either grounded (through an internal switch) or completely disconnected. Disconnecting P3.4 from ground after an ADC conversion reduces current consumption. Connecting and disconnecting P3.4 from ground is software driven. See the ADC Circuit section in the UG-231 User Guide for more details on this configuration.
Figure 2 shows a flow chart of the software controlling the data acquisition system. After the interrupt and timer setup stage, the ADuCRF101 is switched to hibernate mode. After two wind speed interrupts are received, the ADuCRF101 enters flexi mode, and the Cortex-M3 becomes active. The wind speed is calculated from the wake-up timer values. Next, the ADC is configured, and the wind direction calculated. Subsequently, the ADuCRF101 is put back into low power hibernate mode. When 10 seconds pass and two wind speed interrupts have occurred, the ADuCRF101 wakes up in flexi mode. The transceiver is woken up and transmits the speed and direction data. Immediately after transmission, it is put back to sleep. Finally, the ADuCRF101 returns to hibernate mode. For this circuit, the transmitter is setup to transmit at the maximum speed of 300 kbps with a frequency deviation of 75 kHz. To conserve power, use the highest transmit data rate.

Figure 3 shows the power consumption vs. time of a single data transmission sequence. In this circuit, the differential power amplifier (PA) was used at maximum power (10 dBm). The frequency of operation was set to 433 MHz. At 10 dBm output power, the PA consumed in the order of 21 mA.

The amount of time the transceiver transmits at maximum power is minimized by using the maximum ADuCRF101 data transmission rate of 300 kbps. The power consumption can be reduced further by reducing the output power of the PA. The optimal PA output power depends on the transmission distance required in the application. From Figure 3, the average power used in a single transmission sequence in one 10 second period is 22 µA. This translates into a CR2032 lithium battery lifetime of approximately 1.2 years. In reality, the lifetime of the battery can be longer because this example assumes a transmission occurs every 10 seconds and does not take into account the case where there is no wind and thus no transmissions.
Common Variations
The frequency of data transmission can be changed to any value, for example, every minute instead of every 10 seconds. This has a large effect on the overall power consumption. Another parameter that can be varied is the data rate at which the data is transmitted. Normally, 300 kbps is used, but 38.4 kbps and 1 kbps are alternatives. The advantage of using a lower data rate is increased transmission distance for the same output power. The disadvantage is that it takes longer to transmit and thus increases overall power consumption. If a different frequency is needed, the EV-ADuCRF101MK1Z board can be used. This alternative evaluation board can be programmed to operate anywhere in the 862 MHz to 928 MHz band.
Other alternative parts that can be used in this application are the ADF7023 UHF transceiver with a microcontroller. Used together, these provide the same functionality of the ADuCRF101; however, they add complexity.
Circuit Evaluation & Test
Equipment Needed
The following equipment is needed:
- Two of each: EV-ADuCRF101MK3Z evaluation boards, 433 MHz antenna, and software
- The USB-SWD/UART-EMUZ converter board with the J-Link Lite emulator included. This board is available as part of the EV-ADuCRF101QS3Z Quick Start Kit
- A passive anemometer (for example, from Davis Instruments)
- A PC (Windows® 32-bit or 64-bit)
Setup
To setup the circuit, do the following:
- Connect the anemometer to the EV-ADuCRF101MK3Z evaluation board. Make the connections in accordance with Figure 1. It can be connected directly using cables to the edge vias on the evaluation board or through a motherboard on which the evaluation board is mounted.
- The EV-ADuCRF101MK3Z then collects and transmits the anemometer data (Tx board).
- The USB-SWD/UART-EMUZ board is then connected to the Tx board to enable code to be downloaded to the part. The code is contained on the DVD that comes with the evaluation board kit. Download the anemometer_transmit.c code to the part. The download is done via the J-Link Lite emulator. See the evaluation board user guide for details on how to download code to the part from the DVD. This code sets up P0.7 as an interrupt, sets up the ADC1 channel, and executes as outlined in Figure 2.
- Connect the USB-SWD/UART-EMUZ to the second EV-ADuCRF101MK3Z to download the anemometer_receive.c code. This code sets up the evaluation board EV-ADuCRF101MK3Z in receiver mode (Rx evaluation board) and outputs the wind speed and direction data when received on the UART.
- The graphic user interface (GUI) of the Rx board can be installed on the PC to view the wind speed and direction data. Execute the anemometer_Demo.exe file to install the GUI,proceed through any dialog boxes that appear to finish the installation.
As shown in the flow chart in Figure 2, the Tx board transmits data every 10 seconds when available. If there are no interrupt incidents on P0.7 (that is, no wind), there is no transmission. The Rx board immediately receives that data and outputs it via the UART-to-USB converter board to the GUI running on the PC.
Functional Block Diagram
A function diagram of the test setup is shown in Figure 4.
Test
The COM port and baud rate of the connection from the GUI to the receiver board needs to be set. The baud rate is fixed to 19200 kbps, and the COM port number hasto set correctly to the one being used by the USB cable. The GUI continually updates as new data arrives; it currently does not auto zero when no data arrives for an extended period of time. Note that to minimize power consumption on the Tx board, remove LK1, which turns off the red LED and thus reduces power consumption.
The UG-480 User Guide provides a detailed description of how to use, program, debug, and evaluate the ADuCRF101 evaluation board. The user guide describes all the features of the board, including the interface method. It also contains a complete bill of materials (BOM) and a schematic for the board.
The UG-231 User Guide is a comprehensive reference document on the functionality and features of the ADuCRF101. This user guide explains in detail how to configure and use all the features of the part, including the features used in this application (that is, timers, hibernate mode, ADC, interrupts, and transceiver operation).


