Coherent Sampling with PScope
The most common problem we encounter in interpreting data from PScope is non-coherent sampling. A non-coherent signal is one in which a complete period is not sampled in the data record. This means there is a partial period that is sampled (Figure 1). The non-complete period is translated into frequency spreading when viewed in the frequency domain (Figure 2). This severely degrades the SNR of the ADC, causing people to think that the SNR is not up to datasheet spec. This is only because of the mathematical spreading not the ADC itself.

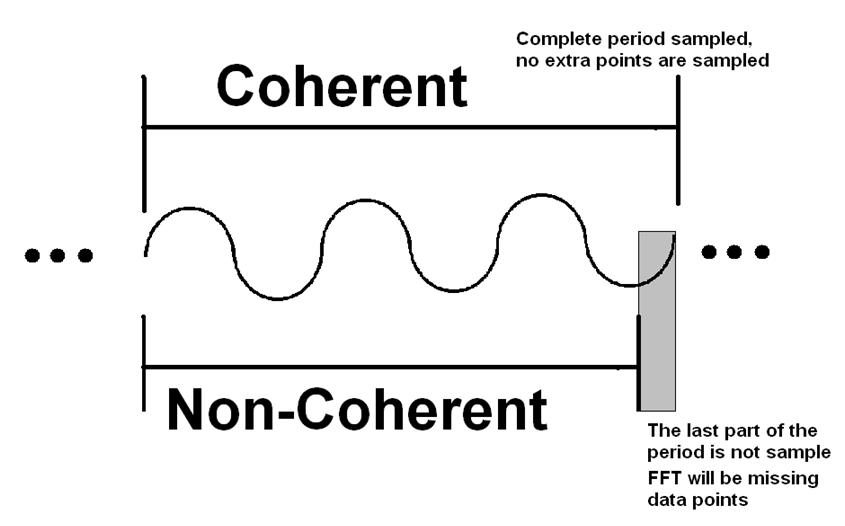
Figure 1. Coherent and Non-Coherent Sampling Time Domain


Figure 2. Coherent and Non-Coherent Sampling Frequency Domain
To correct for this issue, a windowing function can be used. A windowing function is a raised cosine function that is applied to the data record. It applies a weighting factor to each of the discrete samples in the record to exaggerate the center of the record and attenuate the extremes. This means the unfinished period that causes the frequency spreading will be suppressed, and the noise floor will appear flat. Windowing will solve the problem of non-coherent signaling. It corrects the signal so that the SNR will be correct (Figure 3).


Figure 3. Windowing
The drawback of this technique is that the power of the fundamental will be spread into the neighboring bins of the frequency domain. This means that the total power in the bin of the fundamental will be reduced. Depending on the window used it can be significant. For example, the Blackman-Harris 92dB window will reduce the power in the bin of the fundamental by 6dB. The power is spread into two bins on either side of the fundamental. By integrating these bins, the total power can be found (Figure 4). PScope has these functions built in, and does the integration automatically.


Figure 4. Effects of Windowing
To eliminate the need for a windowing function, coherent signaling is required. For a given sample rate a coherent signal can be found with this equation:

Where fIN is the input frequency, fS is the sample rate and Nsamples is the transform size. Mcycles needs to be an integer. This equation can be solved by pluging in the known variables, fIN, fS, and Nsamples. This will give a decimal value for Mcycles. By rounding this to the nearest integer and then solving for fIN the appropriate input frequency can be calculated, and entered into the signal generator. It typically will require 6 digits of accuracy.
Included in PScope is a coherent frequency calculator, which will calculate coherent input frequencies for a given sample rate (Figure 5). First enter in the sample rate (Point 1 in Figure 5 below). Click the processing options icon on the tool bar (Point 2 in Figure 5 below), and enter the desired input frequency in the proper box (Point 3 in Figure 5 below). Hit "Calculate" and the actual coherent frequency will appear. Plug the coherent signal frequency into the generator exactly and the signals will be coherent, and windowing won’t be required.


Figure 5. PScope Coherent Frequency Calculator
著者について
LTC2246Hのデモ・ボードであるDC1151を始め、リニアテクノロジーのほぼ全ての高速ADCデモ・ボードの設計に携わってきました。これらのボードは、評価用ボードとして様々なアプリケーションで用いられています。Clarenceの設計したデモ・ボードは、アンプとADCを合わせたフル・シグナル・チェーンを有...
この記事に関して
最新メディア 21