Overview
Design Resources
Design & Integration File
- Schematic
- Bill of Materials
- Gerber Files
- Assembly Files
- Allegro Files
Evaluation Hardware
Part Numbers with "Z" indicate RoHS Compliance. Boards checked are needed to evaluate this circuit.
- EVAL-ADICUP360 ($52.97) ADuCM360 Arduino Form Factor Compatible Development System
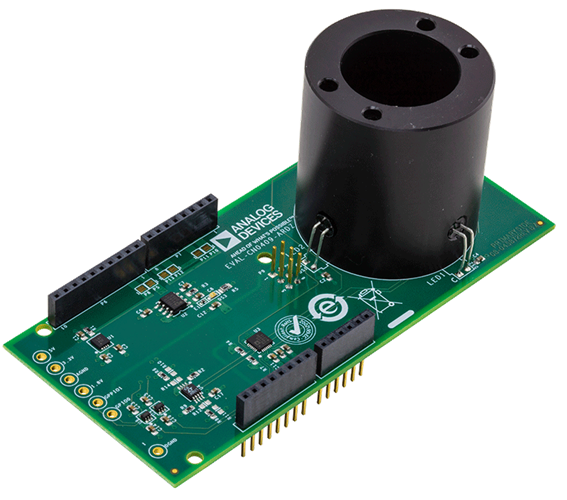
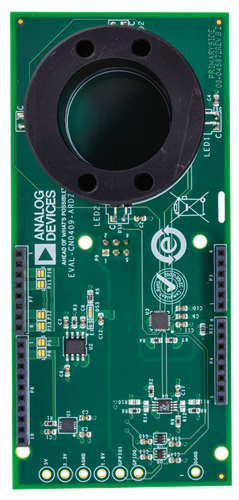
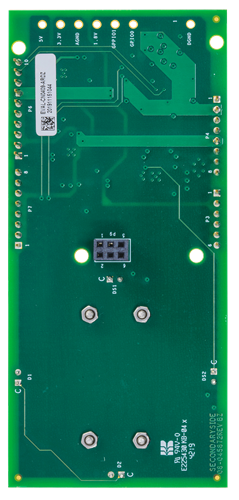
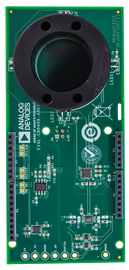
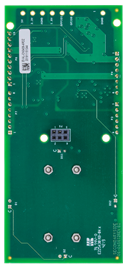
- EVAL-CN0409-ARDZ ($176.55) Turbidity Measurement Arduino Shield
Features & Benefits
- 0-4000 FTU Measurement
- +/-0.5 FTU system accuracy (0-1000 FTU)
- Ambient light rejection
Markets and Technologies
Parts Used
Documentation & Resources
-
CN0409 User Guide3/14/2018WIKI
-
CN0409: Low to High Level Water Turbidity Measurement System (Rev. 0)5/10/2018PDF202 K
Circuit Function & Benefits
The circuit shown in Figure 1 uses a photometric front end and a network of 860 nm infrared (IR) emitters and silicon PIN photodiodes to achieve a water turbidity measurement system. Turbidity is an important water quality indicator for the presence of dispersed or suspended solids, which affects potable water and environmental conditions. Turbidity is a qualitative characteristic imparted by how these suspended solids obstruct the transmittance of light. Turbidity is not a direct measure of suspended particles in water but rather a measure of the scattering effect that such particles have on light.

The system can measure low to high water turbidity levels ranging from 0 FTU to 1000 FTU. The IR LED and photodiode network is arranged in such a way that it can support two of the most recognized turbidity measurement standards: ISO7027 (both ratio and nonratio) and the GLI method. With three-point calibration, the typical accuracy that the system can achieve is ±0.50 FTU or ±5% of the reading, whichever is greater. This accuracy combined with the 0.05 FTU noise level makes the measurements obtained using this system very reliable.
The ADPD105 ambient light rejection feature makes this circuit ideal for applications where accurate, robust, and noncontact turbidity measurements are critical. Applications include chemical analysis and environmental monitoring of natural bodies of water (such as wastewater and drinking water).
The printed circuit board (PCB) is designed in an Arduino shield-compatible form factor and directly interfaces to the EVAL-ADICUP360 Arduino form factor-compatible platform board for rapid prototyping.
Circuit Description
Turbidity Measurement
An important water quality indicator for almost any use is the presence of dispersed, suspended solids—particles not in true solution (often including silt, clay, algae, other microorganisms, organic matter, and other minute particles). Turbidity is a qualitative characteristic imparted by how these suspended solids obstruct the transmittance of light. Turbidity is not a direct measure of suspended particles in water but rather a measure of the scattering effect such particles have on light.
Photometric Front End
The CN-0409 circuit uses the ADPD105 photometric front end operating as a complete optical transceiver stimulating two 860 nm infrared emitters (DS1 and DS2) and silicon PIN photodiodes (D1 and D2). The data received from the photodiodes measures the amount of scattered energy as it passes through the solution under test. Less than 1 FTU turbidity solutions introduce little or no obstruction to light; therefore, the measured scattering effect is negligible. With an increase in turbidity, the number of suspended solids also increases, hindering the straight beam of light and scattering some of the energy in the process. The proportional relationship between turbidity and scattered light is the underlying principle used in most turbidity measurement techniques.
Ambient Light Rejection
The ADPD105 operates in two independent time slots, Timeslot A and Timeslot B, which are carried out sequentially. Each LED pulse coincides with a sensing period so that the sensed value represents the total charge acquired on the photodiode in response to only the corresponding LED pulse. Charge, such as ambient light, that does not correspond to the LED pulse is rejected. This feature of ADPD105 makes the circuit robust under different lighting conditions.
The entire signal path from LED stimulation to data capture and processing is executed during each time slot sequentially. Each time slot has a separate data path that uses independent settings for the LED driver, analog front end (AFE) setup, and the resulting data. The circuit drives a 100 mA pulse to the LED for 2 μs corresponding to an 860 nm emitted light. Charge corresponding to a specific LED pulse accumulates in the photodetector, and that charge is digitized inside the ADPD105. To increase signal resolution, 16 subsequent pulses are averaged by the digital engine of the ADPD105.
Power and Digital Considerations
The circuit uses two ADP7105 low dropout (LDO) linear regulators with different fixed supply voltage output (1.8 V and 3.3 V). The 1.8 V output powers the ADPD105, and the 3.3 V output biases the LEDs. The ADP7105 provides very good noise (15 μV rms) and line regulation (±0.015%), which is critical in ensuring that the light intensity is repeatable for every measure-ment sample. These factors contribute to the fast (<12 sec) and precise turbidity measurements of the CN-0409.
Turbidity Measurement Standards
The International Organization for Standardization (ISO) developed a design standard known as ISO7027 Water Quality—Determination of Turbidity, which is best known for its requirement of a monochromatic light source. Most instruments that comply with this standard use an 860 nm LED light source and a primary detector at an angle of 90°. Additional detection angles are allowed, such as a detector at an angle of 180°, to increase the range of measurable turbidity levels.
For turbidities between 0 FTU and 40 FTU, the 90° detector provides the most linear response to scattering. At low turbidity levels, the particles are much smaller than the wavelength of incident light; therefore, they exhibit a symmetrical scattering distribution. As the number and size of suspended solids increase within this range, the 90° detector receives a linearly proportional amount of scattered light. This method is also known as the nonratio ISO7027 because of the use of just one detector.

Higher turbidity levels in the range of 40 FTU to 4,000 FTU require an additional detector to obtain the same linear response as the nonratio method. Larger particles present in these types of solutions exhibit an asymmetrical light scattering distribution that results in a higher intensity forward scattered light. The ISO7027 ratio method of the CN-0409 uses the ratio of the 90° detector and the 180° detector to measure turbidity levels of theoretically up to 4,000 FTU.

ISO7027 Nonratio Implementation
The ADPD105 can support up to four photodetectors and three LED light sources. To implement an ISO7027 nonratio measurement method, the CN-0409 uses two IR LEDs and two photodetectors. The core circuitry of the ADPD105 stimulates the LEDs and measures the return in the analog block through the two photodetectors. The LEDs are stimulated in two different time slots, and these time slots are carried out sequentially. The entire signal path from LED stimulation to data capture and processing is executed during each time slot, which is critical in preventing the two LEDs from interfering with each other.
During Timeslot A, LED2 is stimulated, and the corresponding scattered light is sensed using the 90° detector, D2. The same happens to LED1 for Timeslot B using the D4 detector. In actuality, only one timeslot is needed to perform a nonratio measurement. However, because the CN-0409 network of LEDs and photodetectors are arranged in such a way that another data point can be extracted from another timeslot, that data point is also used. The final FTU measurement is calculated as follows:

where:
m is the slope obtained from calibration (FTU/LSB).
D2 is the code from Detector D2 during Timeslot A (LSB).
D4 is the code from Detector D4 during Timeslot B (LSB).
b is the intercept obtained from calibration (FTU).
ISO7027 Ratio Implementation
The CN-0409 implements an ISO7027 ratio method that is similar to the nonratio implementation but with an additional 180° detector.
An additional detector is required in measuring turbidity levels higher than 100 FTU because the large particles present in these solutions exhibit an asymmetrical scattered light distribution. The CN-0409 uses the ratio of the 90° detector over the 180° detector to extend the linear range of its turbidity measurements. The final FTU measurement is obtained using the following equation:

where:
m is the slope obtained from calibration (FTU/LSB).
x is the ratio of the 90° detector code over the 180° detector code during Timeslot A.
y is the ratio of the 90° detector code over the 180° detector code during Timeslot B.
b is the intercept obtained from calibration (FTU).
Autoranging Capability
As explained before, each standard is only accurate at certain turbidity ranges. The ISO7027 nonratio method is only accurate for turbidity levels of 0 FTR to 40 FTU, and the ratio method is for higher turbidity levels of 40 FTU to 1,000 FTU. The software provided exhibits an autoranging capability that chooses the appropriate standard for a solution under test, which ensures that turbidity levels being reported are always accurate and reliable.
The autoranging flow is a simple process of comparing to a threshold, and is shown in Figure 4.

System Accuracy
The CN-0409 circuit exhibits accuracy that closely resembles commercially available turbidity meters. Table 1 shows the side-by-side specification of the CN-0409 and a commercial turbidity meter.
| Parameter | Commercial Turbidity Meter | CN-0409 |
| Range | 0 FTU to 1,000 FTU | 0 FTU to 1,000 FTU |
| Accuracy | ±0.5 FTU or ±5% of reading (whichever is greater) | ±0.5 FTU or ±5% of reading (whichever is greater) |
| Noise | Not applicable | 0.05 FTU (0 FTU to 1,000 FTU) |
| Calibration | Three point: 0 FTU, 10 FTU, 500 FTU | Three point: 0.02 FTU, 100 FTU, 800 FTU |
| Standard | ISO7027 nonratio (single LED measurement) | ISO7027 nonratio and ratio (dual LED measurement) |
| Measurement Time | 25 sec | <12 sec |
The CN-0409 performs well against the commercial turbidity meter in terms of measuring the same solution set. As shown in the Figure 5, the errors obtained using the CN-0409 are better than the commercially available turbidity meter.

Calibrating for Accuracy
The process of calibrating and verifying calibration of turbidity meters at ultralow turbidity levels is very sensitive to both user technique and the surrounding environment. When measured turbidity levels drop below 1.0 NTU, the interferences caused by bubbles and particulate contamination, which can be slightly problematic at higher levels, can result in a false positive reading and invalid verification results.
A pseudo-three-point calibration routine is required by the CN-0409 to obtain the high level of accuracy necessary for high precision turbidity measurements. The CN-0409 is preprogrammed with factory calibration coefficients; however, depending on the variables, such as the vial and calibration solutions available, the circuit needs to be calibrated after a certain period of time. The solutions used for calibration are 0.02 FTU, 100 FTU, and 800 FTU from Oakton (T100 calibration kit). Figure 6 shows the calibration regions for the CN-0409. The nonratio method that is used for low turbidity measurements uses the 0.1 FTU and 100 FTU solutions to obtain the calibration slope and intercept. The ratio method, on the other hand, uses the 100 FTU and 800 FTU solutions to obtain the necessary calibration values.

System Noise Performance
The noise level of the CN-0409 is only ± 0.05 FTU, providing turbidity measurements that are repeatable.

Practical Considerations
In practical applications, there are many sources of errors in a turbidity measurement setup that can introduce interference and reduce the accuracy of any instrument. One of these sources of error is stray light.
Stray light is a significant source of error in low level turbidity measurements. Stray light reaches the detectors of an optical system, but does not come from the sample. An instrument responds to both light scattered from the sample and stray light sources within the instrument. To minimize the effects of stray light, observe the following guidelines:
- Sample vials must be meticulously cleaned. Cleaning involves washing the vials with soap and deionized water, soaking the sample vial in hydrochloric acid solution, rinsing with ultra-filtered deionized water, and polishing with silicone oil.
- Sample vials must be indexed. After the cleaning process, the vial is used to measure a very low turbidity solution. Index the position with the lowest measured turbidity, and use this position for succeeding measurements.
- Remove bubbles in the solution by letting the solution stand for several minutes to allow the bubbles to vacate.
- If possible, use one properly indexed sample vial.
Common Variations
Using the ADPD105 allows flexibility and customization for turbidity and general photodiode designs. Connecting a third and fourth photodetector at 135° and 45° angles allows the user to implement a more sophisticated ratiometric measurement for a wider range of turbidity levels up to 10,000 FTU.
Circuit Evaluation & Test
This circuit uses the EVAL-CN0409-ARDZ shield circuit board and the EVAL-ADICUP360 Arduino-compatible platform board. A user guide for the platform board is available at www.analog.com/EVAL-ADICUP360.
Equipment Required
The following equipment is needed:
- EVAL-CN0409-ARDZ circuit board
- PC with a USB port and Windows® 7 (32-bit) or higher.
- EVAL-ADICUP360 Arduino-compatible platform loaded with CN-0409 firmware.
- Serial terminal software (PuTTY, Tera Term, or similar).
- USB type A to USB micro cable.
- Test vials.
- Turbidity calibration solutions: Oakton T100, HI88703-11, or Cole Palmer turbidity kit.
Test Setup Functional Block Diagram
A functional diagram of the test setup is shown in Figure 8.

Setup
To set up the circuit for evaluation, take the following steps:
- Plug the EVAL-CN0409-ARDZ shield board into the EVAL-ADICUP360 platform board.
- Following the instructions in the EVAL-ADICUP360 user guide, connect the EVAL-ADICUP360 virtual COM USB port to the PC.
- Set up the serial terminal software to match the UART setting of the CN-0409 firmware and select the correct virtual COM port.
- Press the reset button on EVAL-ADICUP360 board, and the software displays the steps of water turbidity measurements.
Details of the operation of the hardware and software are available in the CN-0409 user guide at www.analog.com/CN0409-UserGuide.
A photograph of the sample test setup of water turbidity measurement using the EVAL-CN0409-ARDZ circuit board and the EVAL-ADICUP360 Arduino shield board is shown in Figure 9.


