AN-1271: Optimizing the ADuCM350 for Impedance Conversion
Introduction
The ADuCM350 is an ultralow power, integrated, mixed-signal metering solution that includes a microcontroller subsystem for processing, control, and connectivity. The processor subsystem is based on a low power Arm® Cortex™-M3 processor, a collection of digital peripherals, embedded static random access memory (SRAM) and flash memory, and an analog subsystem which provides clocking, reset, and power management capability.
This application note details how to set up the ADuCM350 to optimally measure the impedance of a resistor capacitor (RC) sensor using a 2-wire measurement approach. To optimize the accuracy of the impedance measurement, the user must maximize the usage of the 16-bit analog-to-digital converter (ADC) range.
To maximize this usage, the peak-to-peak excitation output voltage, transimpedance amplifier (TIA) resistance/capacitance (RTIA/CTIA) combination, and the calibration resistor (RCAL) must be calculated. The maximum allowed current into the load dominates the calculation.
If there is no limitation, the user has the ability to maximize the amount of signal swing into the ADC from the TIA to get the best signal-to-noise ratio (SNR) possible.
However, if there is a limitation on the load current, for example, to meet IEC 60601 standards in 2-wire, bioimpedance applications, the user must calculate the maximum allowable current and use precautionary measures in the circuitry.
Details
Sensor Configuration
In the example described in this application note, the user wants to measure the impedance of an RC type sensor with the configuration shown in Figure 1 for a 1 kHz excitation signal.
The sensor details include the following:
- Parallel capacitor (CP) = 10 nF to 600 nF
- Parallel resistor (RP) = 10 kΩ
- Series resistor (RS) = 1 kΩ


Figure 1. Sensor RC configuration.
Calculate the Minimum Ideal Impedance of the Sensor
First, calculate the minimum unknown impedance of the sensor. This calculation allows the user to calculate the highest current signal into the TIA.
For the sensor shown in Figure 1, the impedance of the sensor is at its minimum when CP = 600 nF.
To calculate the total impedance (ZT), first calculate the impedance of the CP capacitor (ZCp).

where:
f is an excitation frequency of 1 kHz.
CP is 600 nF.
Next, calculate the impedance of the parallel components RP || CP.
1/ZP = 1/ZRp + 1/ZCp
where:
ZP is the impedance of parallel components.
ZRp is the impedance of the RP parallel component.
or to simplify,
YP = YRp + YCp
YRp = 1/10,000
YCp = 1/−i265.26
YP =1× 10⁻⁴ + i3.77 × 10−3 (C lags by 90°).
where:
YP is the admittance of parallel components.
YRp is the admittance of RP.
YCp is the admittance of CP.
Use the following equation to calculate the magnitude of YP:

where:
R is the real component.
I is the imaginary component.
Invert this value to get ZP.
|ZP| = 265.16 Ω
Calculate the phase of YP.
Phase (rads) = atan (I/R) = 1.544

Impedance of parallel RC = ZP = 265.16 ∠ −88.48°
Now, add the RS series resistor:
ZT = ZP + ZS
ZP = 265.16 ∠ −88.48 = 7.03 – i265.06
ZS = 1000 ∠ 0 = 1000 + i0
Add the two complex numbers:
ZT = 1007.03 – i265.06 = 1041 ∠ −14.75
This ZT value is the lowest impedance realized by the device and it determines the maximum amount of current seen by the TIA.
RCAL Calculation
To calculate the RCAL value to calibrate the system, the lowest unknown impedance, Z, is used. If RCAL is equal to the magnitude of minimum impedance, the signal going into the discrete Fourier transform (DFT) is large. This scenario improves repeatability and accuracy.
An RCAL of ~1041 Ω is used for this example.
Scenario 1: No Limitation on Load Current
The maximum signal swing is used to maximize the SNR of the ADC results where there is no limitation on current seen by the load. Scenario 1 occurs under the following conditions:
- The maximum voltage swing is 600 mV peak.
- The highest signal current into TIA = 600 mV peak/1041 Ω = 0.576 mA peak.
- The peak voltage at output of TIA (the maximum allowed by the ADuCM350) = 750 mV peak.
- The RTIA resistor to give peak 750 mV voltage for peak
signal current is
750 mV/0.576 mA = 1.302 kΩ
To improve the antialiasing performance and stability of the receive channel, an antialiasing capacitor is put in parallel with RTIA. The 3 dB point of 80 kHz is selected (this is the maximum bandwidth of the system).
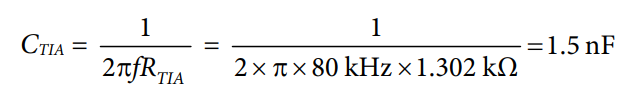


Figure 2. Signal swings with no limitation on load current.
Scenario 2: Limited Load Current
When there is a limitation on the load current, a different approach is taken. In this example, the IEC 60601 bodily floating standard allows a maximum of 100 µA rms leakage. For this example, it is safe to assume that 50 µA rms or 70.7 µA peak is the maximum current.
From a single fault correction perspective, with regard to the bodily floating standard, the following is included on each leg of the sensor lead (see Figure 3):
- A 1 µF dc blocking series capacitor (CS)
- A series resistor representing some form of leads (RLEAD)
Connect an extra current limiting series resistance of 200 Ω to the drive leg, RLIMIT.


Calculating the impedance of extra circuitry in the network gives the following:
200 Ω + 100 Ω + 100 Ω + 1 µF + 1 µF
Assume an excitation frequency of 1 kHz.
Capacitors are in series, therefore,
CT = (C1 × C2)/(C1 + C2)
where CT is the total capacitor and is equal to 0.5 µF.
ZC = 1/(2 πfCT) = 1/(2 × π × 1 kHz × 0.5 µF) = −i318.3
RT = RLIMIT + RLEAD + RLEAD = 400
Total extra circuitry impedance = 400 – i318.3
where ZC is the capacitor impedance.
The minimum impedance seen by the TIA is the minimum sensor impedance plus the minimum extra circuitry impedance converter.
ZT = (400 – i318.3) + (1007.03 – i265.06) = 1407 – i583.4 = 1523 ∠ −22.5
This value shows the minimum impedance seen by the ADuCM350. For safety reasons, reduce this value by 20% to avoid unwanted overranging of the ADC results.
Therefore, a minimum impedance of 1218.4 Ω is assumed. The Cortex-M3 flags any impedance measurement below this value as an invalid result. If a flag occurs, check the connections, because the flag indicates that the ADC has overranged or encountered another error.
To allow a maximum of 70.7 µApeak with a minimum impedance of 1218.4 Ω, a sine wave amplitude is needed.
70.7 × 10−6 × 1218.4 Ω = 86 mV peak
Note that the maximum allowed sine wave amplitude when the digital-to-analog converter (DAC) attenuator is enabled, DAC_ATTEN_EN = 1 is 15 mV peak. Because 86 mV peak exceeds this value, there are two options to correct this. The first option is to use 15 mV peak with a reduced SNR. The second option is to disable the DAC attenuator and select 86.5 mV peak in nonattenuation mode. The downside of this second option is that the LSB size increases 40×.
In nonattenuator mode,
LSB size = 1.6 V/212 = 390 µV p-p = 195 µV peak
In attenuator mode,
LSB size = 1/40 (1.6 V/212) = 9.76 µV p-p = 4.88 µV peak
With a bigger LSB size, there is less resolution of measurement, which results in more quantization noise in creating the sine wave and measuring the response.
Continuing with this example, proceed using a 15 mV peak sine wave with the attenuation enabled (DAC_ATTEN_EN = 1).
Calculate the current seen by the TIA.
15 mV peak/1218.4 Ω = 12.3 µA peak signal
Then, calculate the value of RTIA and CTIA to optimize the ADC range, where the RTIA resistor gives the peak 750 mV voltage signal current.
750 mV/12.3 µA = 60.98 kΩ
To improve the antialiasing performance and improve the stability of the receive channel, an antialiasing capacitor is put in parallel to RTIA. The 3 dB point of 80 kHz is selected (the maximum bandwidth of the system).
CTIA = 1 ÷ 2πfRTIA = 1 ÷ (2π × 80 kHz × 60.98 kΩ) = 32.6 pF


Figure 4. Signal swings with limitation on load current.
Impedance Measurement Example In LabVIEW
The ADuCM350 LabVIEW® graphical user interface (GUI) can measure impedance and rapidly prototype sensor measurement.
Figure 5 shows the LabVIEW impedance measurement analog front end (AFE) control window. Figure 6 shows the LabVIEW impedance measurement plot.


Figure 5. LabVIEW impedance measurement AFE control.


Figure 6. LabVIEW impedance measurement.
Impedance Measurement Example in Software Development Kit
The IAR Embedded Workbench-based software development kit includes an ImpedanceMeasurement_2Wire.c example. This example verifies the performance of the impedance converter on the ADuCM350.
The sequence for the example is measuring three unknown 2-wire impedances: AFE 3 to AFE 4, AFE 4 to AFE 5, and AFE 5 to AFE 6.
The code has programmability for excitation frequency, excitation voltage, and RCAL value. It is possible to code other changes to the measurement into the measurement sequence. The Readme.txt file of this example project provides full details.
Figure 7 shows an example measurement. The real and imaginary components are calculated.


Figure 7. Signal swings with limitation on load current, impedance Measurement_2Wire.c example.