AN-2554: Step Counting Using the ADXL367
INTRODUCTION
This application note describes the implementation of a pedometer algorithm for the ADXL367, a 3-axis digital accelerometer. The algorithm is based on peak detection analysis of the acceleration produced by a step over a predefined time window. Empirical results for a wrist worn use case show approximately 97% average accuracy under different scenarios.
STEP COUNTING USING INERTIAL SENSORS
Step counting is one of the most common functions in any fitness wearable and it is usually achieved utilizing digital inertial sensors, such as accelerometers and gyroscopes.
The main two methods to count steps are discussed in the Analyzing the Swinging Motion of the Arms section and the Measuring the Step Impact Acceleration section.
ANALYZING THE SWINGING MOTION OF THE ARMS
One arm naturally swings with the motion of the opposing leg, and the relationship is one arm swing per two steps. In general, gyroscopes are more appropriate for analyzing the swinging motion of the arms.
MEASURING THE STEP IMPACT ACCELERATION
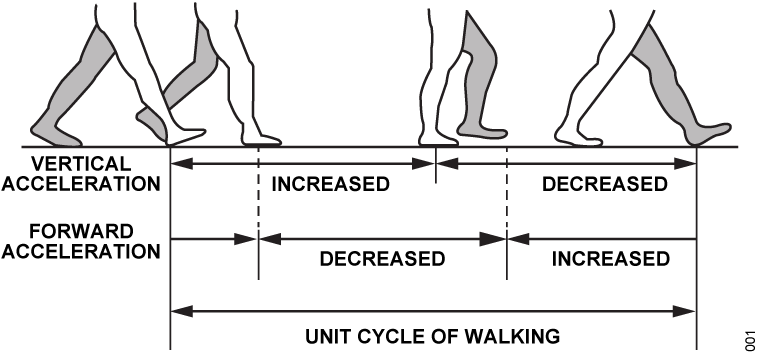
A step, when walking or running, produces forward and vertical acceleration that varies in amplitude and frequency from person to person. The vertical acceleration tends to be of higher magnitude than the forward acceleration, and it occurs at the stage of the walking cycle where the heel of the forward foot contacts the ground, as shown in Figure 1. This characteristic is typically leveraged for step counting using accelerometers and it is the focus of this application note.
It is important for the accelerometer to consume minimal power and to have a small footprint, because in general, fitness trackers are battery operated and compact devices. Also, these devices are usually worn on the wrist, which present two challenges for step impact acceleration detection, as follows:
- The acceleration signal may be somewhat damped compared to other locations of the body like the hips or the ankle.
- There are other movements such as the arm swing, when jumping an obstacle while running, or waving hello to a friend, that generally have frequency components within the step signal bandwidth. Such movements are difficult to discriminate from a step.
The first challenge can be overcome by selecting an accelerometer that is low noise, so that the acceleration signal can be picked up even if attenuated. The accelerometer also needs to be small with low power consumption to be suitable for wearables. The ADXL367 meets all of these requirements.
The ADXL367 is an ultralow power consumption, 3-axis digital accelerometer, with a typical current consumption of only 0.89 μA in measurement mode and as low as 180 nA in wake-up mode. It features a configurable measurement range from ±2 g to ±8 g and 14-bit resolution up to 400 Hz output data rate (ODR). It also includes a deep multimode output first in, first out (FIFO), a built-in temperature sensor, and single or double tap detection. It operates on a supply range from 1.1 V to 3.6 V, and it is available in a 2.2 mm × 2.3 mm × 0.87 mm package. All of these characteristics make the ADXL367 ideal for power and size constrained applications.
Solving the second challenge is related to how the acceleration signal is processed by the step counting algorithm. The three most common step counting algorithm methods are (Xiaomin Kang, 2018) as follows:
- Time domain analysis
- Frequency domain analysis
- Machine learning
In this application note, the time domain analysis method is used because it requires less computational power than the other two methods, while also demonstrating high accuracy at counting steps, over 97%, when using the windowed peak detection approach (Agata Brajdic, 2013).
STEP COUNTING ALGORITHM
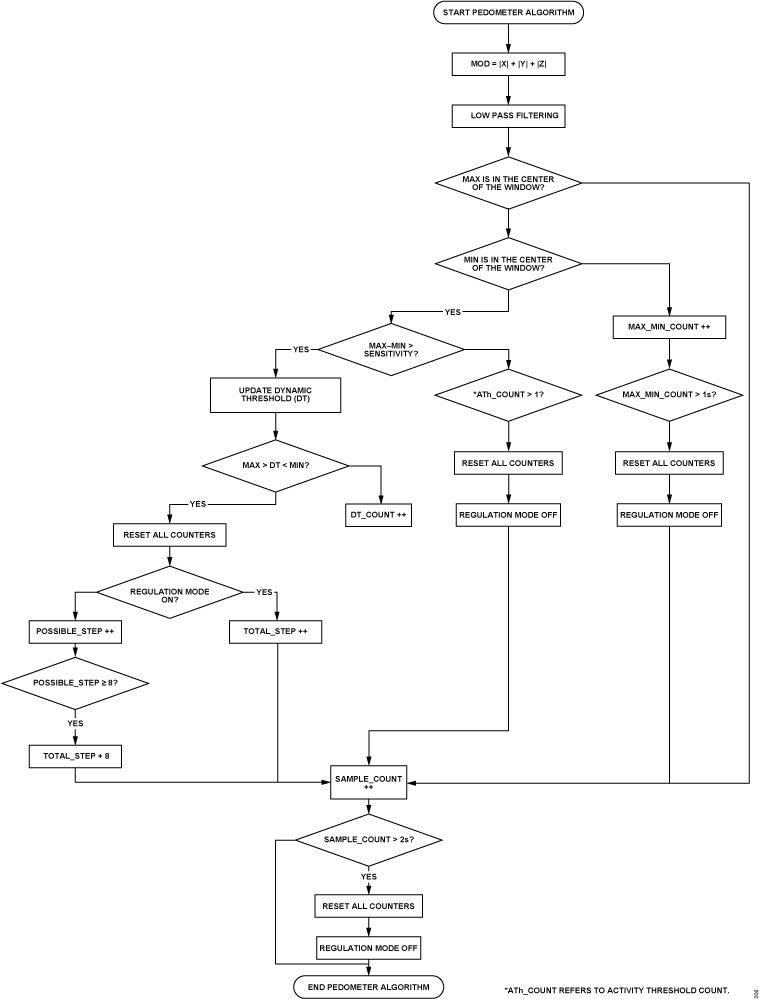
The algorithm developed detects acceleration peaks within a given time window and determines if these are considered a step by analyzing the peak values with respect to a dynamic threshold and the recurrence or repetition of these peaks. The algorithm takes three inputs: x-, y-, and z-axis acceleration data at 50 Hz sampling rate (as 14-bit integers), and returns the total number of steps counted so far. The algorithm implementation is explained next. See Figure 4 for the pedometer algorithm flowchart.
First, the sum of the absolute values of acceleration in the three axes is computed. When walking or running, at least one axis has relatively large periodic acceleration changes, no matter the orientation of the sensor (see the Analog Dialogue article "Full-Featured Pedometer Design Realized with 3-Axis Digital Accelerometer" (Volume 44, June 2010)). Thus, the sum of absolutes must still reflect the walking cycle profile.
Next is the low-pass filtering stage. The sum of absolutes is averaged with the previous three values in a four-sample circular buffer. The averaged signal is then used to detect the maximum and minimum acceleration peaks produced by a step. The algorithm initially looks for a maximum peak within a time window and, when the maximum peak is detected, it starts looking for a minimum peak.
For a sample to be considered a peak, it must also be in the center of the window and be the highest sample (when looking for a maximum) or the lowest sample (when looking for a minimum) within that window. The window size must allow the algorithm to accurately capture the peaks. If the window is too narrow, fluctuations due to noise or other movements can be erroneously interpreted as steps. If the window is too wide, two or more steps are captured within the window, resulting in missing steps because the algorithm detects only one maximum or minimum within that window.
In general, a person can run as fast as five steps per second and walk as slowly as one step every 2 sec. This means that the window must be at least 0.2 sec wide to capture the fastest steps, and narrower than 0.4 sec so that no more than one of the fastest steps is contained within the window. After a maximum peak is detected, the algorithm searches for a minimum for up to 1 sec. If no minimum is found, the algorithm considers there to be no step, it discards the maximum, and starts looking for a new one.
Next, determine if a pair of maximum and minimum peaks can be considered as a possible step. To do this, the concept of dynamic threshold and sensitivity is introduced.
The dynamic threshold is a four-sample circular buffer that works in the same fashion as the low-pass filtering stage, but in this case, the input data is the mean value of maximum and minimum. The dynamic threshold is updated every time the difference between the maximum and the minimum is greater than the sensitivity.
The sensitivity defines a zone near the dynamic threshold amplitude that helps to discard fluctuations that are most likely due to undesired motion. For a pair of maximum and minimum peaks to be considered as a possible step, the following conditions need to be satisfied:
- Maximum peak > (dynamic threshold + sensitivity/2)
- Minimum peak < (dynamic threshold – sensitivity/2)
Finally, the algorithm considers that a person is walking or running if at least eight consecutive possible steps occur, which is an extra measure of the algorithm to avoid false positives due to isolated events, such as waving hello or having a drink. In the next iteration, the software certifies all eight previous possible steps as valid, and enters regulation mode. In this mode, every consecutive step is counted as valid.
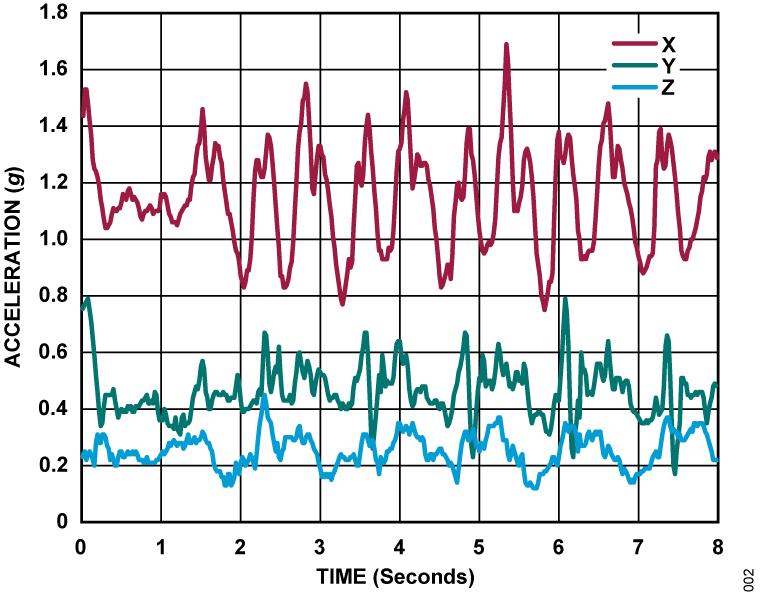
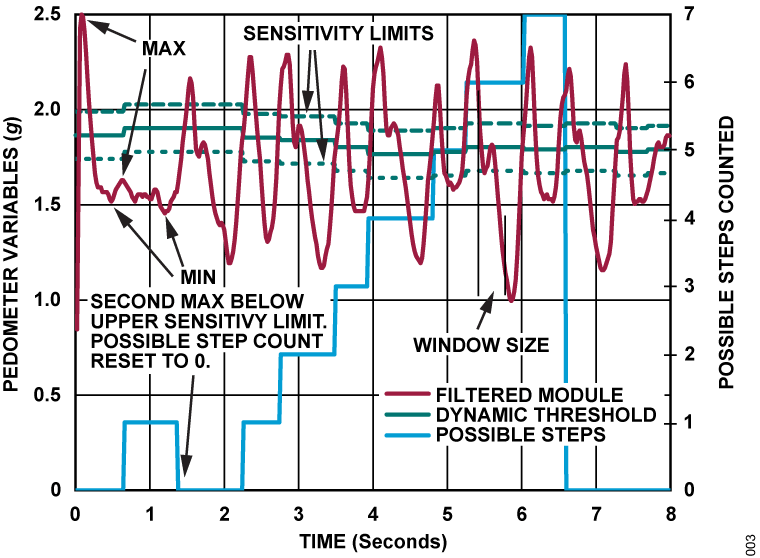
Figure 2 shows an example of an acceleration profile when a person is walking, whereas Figure 3 shows, graphically, how the acceleration data is interpreted and analyzed by the step counting algorithm. In Figure 3, it is shown that a single step is first taken, and the person then rests in place. The possible step count increases to one after the first detected minimum, but because the second maximum does not meet the algorithm condition to be considered a possible step, the possible step count is reset to zero. The person starts walking again at approximately 1.4 sec. At approximately 6.5 sec, the possible step count reaches eight and the software enters regulation mode.
VALIDATION RESULTS
The schematic of the prototype circuit is shown in Figure 5.
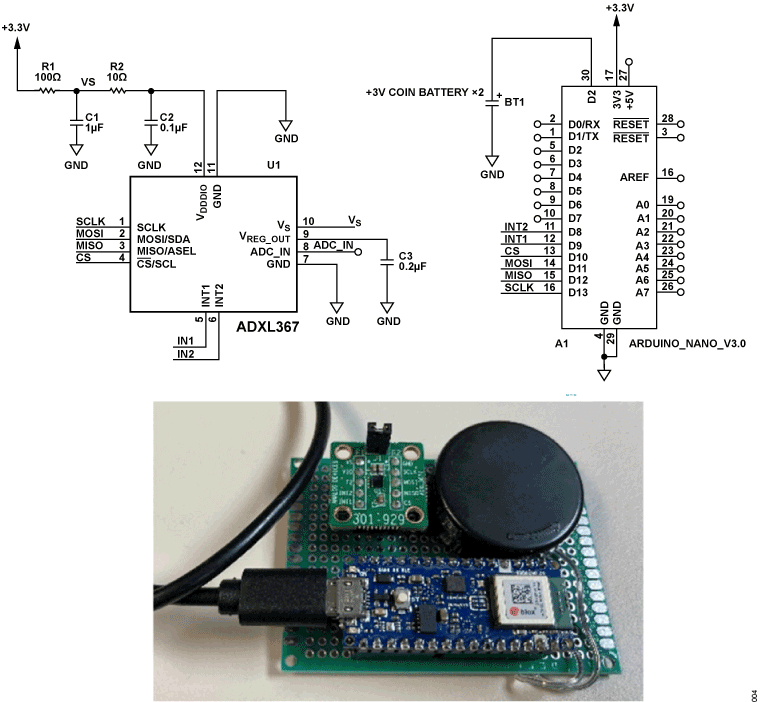
An EVAL-ADXL367Z board, together with an Arduino Nano 33 Bluetooth® low energy (BLE), are used to set up the test platform. The ADXL367 is configured for a single-supply operation. The voltage supply is provided by the 3.3 V Arduino voltage regulator. The Arduino is powered using two 3 V coin batteries in series. See Figure 7 and the Using the Prototype with the Arduino IDE section for more information.
The pedometer algorithm is optimized for a 50 Hz sampling rate. Thus, the ADXL367 ODR is configured accordingly. The acceleration range is set to ±2 g, the FIFO is set to stream mode, and the INT1 interrupt pin is configured to trigger when the FIFO watermark event occurs. The FIFO watermark is set when the number of samples stored in the FIFO is equal to or exceeds the number specified in the FIFO_SAMPLES register. The FIFO_SAMPLES register is set to 24, which is equivalent to eight sets of x-, y-, and z-axis data.
The algorithm parameters must be adjusted by the user for optimal performance, depending on the specific use case. Wrist-worn while running may require different parameter values than hip-worn while walking. These parameters are as follows:
- Window size: defines the buffer size of the window of observation.
- Sensitivity: determines the minimum acceleration that triggers an update of the dynamic threshold.
- Filter order: defines the size of the averaging circular buffer.
- Threshold order: defines the size of the dynamic threshold circular buffer.
Table 1 summarizes the parameter values found to be a good compromise for wrist-worn applications.
| Parameter | Value |
| Filter Order | 4 |
| Threshold Order | 4 |
| Window Size | Filter order × 4 + 1 |
| Sensitivity | 0.1 g |
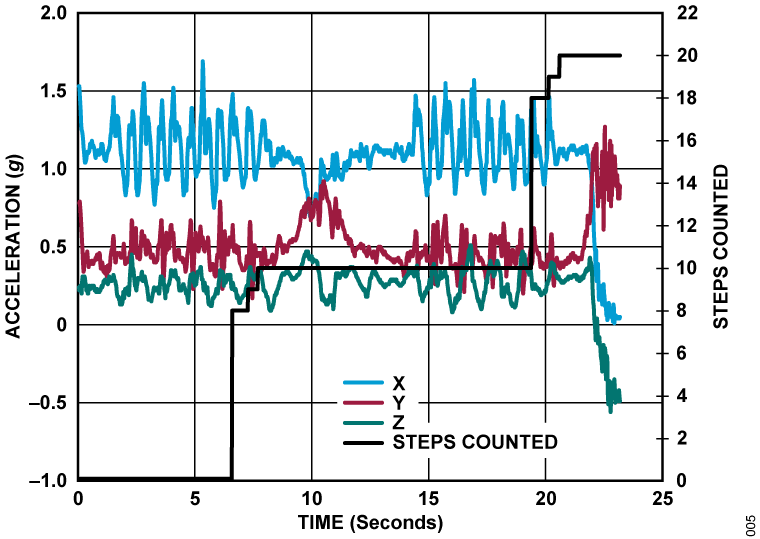
In the example of Figure 6, a person walks 10 steps in one direction, stops walking, turns around, and walks back 10 steps. The acceleration measured by the ADXL367 is shown in blue, red, and green, and the total step count calculated by the algorithm is shown in black.
Validation results, using the parameters of Table 1, are shown in Table 2. The prototype PCB was wrapped to the wrist of the test person with a hook and loop strap. The person was wearing regular running shoes.
| Test | Test Description | Pedometer Step Count | Actual Number of Steps |
| 1 | Walk | 99 | 100 |
| 2 | Walk, busy hands | 101 | 100 |
| 3 | Walk, stop every 10 steps, change direction | 53 | 50 |
| 4 | Run | 103 | 100 |
| 5 | Walk up/down stairs | 98 | 96 |
For Test 1 (walk), the person walked at an average speed of 1.6 steps per second. For Test 2 (walk, busy hands), the test person was walking while holding a cellphone with both hands. Test 5 (walk up/down stairs) was performed on hardwood floor stairs with 12 steps. In this test, the person walked up and down the stairs four times. All tests except for Test 5 (walk up/down stairs) were performed on a concrete floor. The average step counting accuracy obtained from all these tests is 97.4%. Test 3 (walk, stop every 10 steps, change direction) showed 94.3% accuracy, which is the lowest performing test.
To estimate the average processing time of the algorithm, its time of execution was monitored during each of the tests performed in Table 2. The average time obtained was 24 μs.

USING THE PROTOTYPE WITH THE ARDUINO IDE
The pedometer algorithm source code used for the validations test can be downloaded from the ADXL367 product page, Tools & Simulations section.
To use the prototype PCB with the Arduino IDE, follow these steps:
Install the Arduino integrated development environment (IDE) application software from the Arduino website.
Open the Arduino IDE and go to Tools > Manage Libraries.
In the Library Manager window, select Arduino from the Type list, select Communication from the Topic list, and then type ArduinoBLE. Click install.
Connect the universal serial bus (USB) cable to the Arduino and to the PC.
Open the ADXL367 pedometer algorithm project by going to File > Open and selecting the ADXL367_pedometer.ino file.
Go to Tools > Board: Arduino Nano 33 BLE > Arduino Mbed OS Nano Boards, and select Arduino Nano 33 BLE.
Go to Tools > Port and select the appropriate port.
Click the Upload button to upload the program to the Arduino.
The completed upload is indicated as Done, as shown in Figure 13.
Go to Tools and select Serial Monitor.
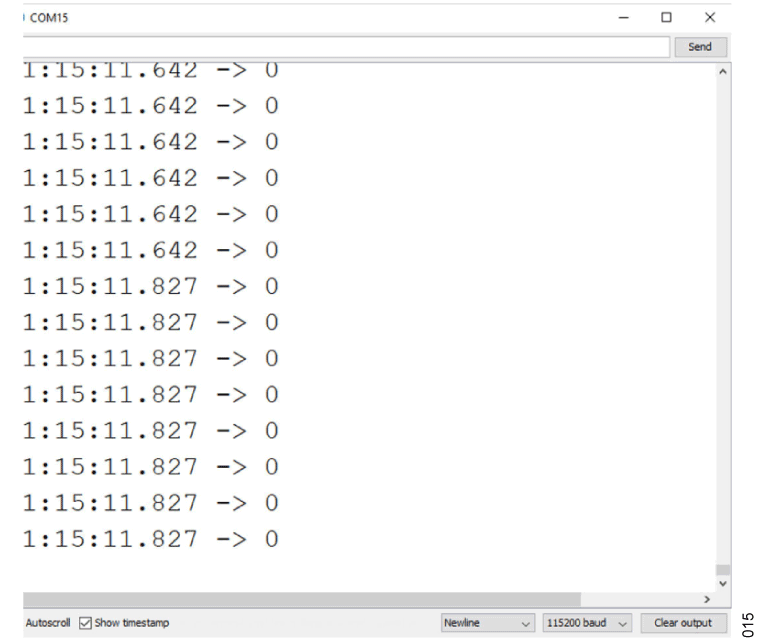
In the window that opens, select 115200 baud from the baud rate list. Figure 15 displays the current step count.
参考电路
Agata Brajdic, R. H. "Walk Detection and Step Counting on Unconstrained Smartphones." ACM international joint conference on Pervasive and ubiquitous computing, (Pages 225–234). 2013.
Xiaomin Kang, B. H. "A Novel Walking Detection and Step Counting Algorithm Using Unconstrained Smartphones. Sensors," 18(1), 297. 2018.
Zhao, N. "Full-Featured Pedometer Design Realized with 3-Axis Digital Accelerometer." Analog Dialogue, 2010.


