Measurement and Control of RF Power (Part I)
Read other articles in this series.
Fig. 1. shows a typical modern communications signal chain. The signal to be transmitted is generated at baseband by a digital-to-analog converter (DAC.) This signal is then mixed up to an intermediate frequency (IF) where it is filtered before being mixed up to the final radio frequency (RF.) On the receive side the inverse transformation takes place. The received signal is amplified, mixed down to IF and filtered before being mixed down to baseband where it is digitized.

Fig. 1: A Modern RF Signal Chain
While signal chains such as these come in all shapes and sizes, there is a universal need in communications applications for measurement and control of signal power. On the transmit side we must ensure that the power amplifier (PA) is meeting regulatory emissions requirements. We must also ensure that the PA is not transmitting above some power level that will cause it damage by overheating.
On the receive side, the input signal level will generally vary over some dynamic range. This may be due to weather conditions or to the source of the received signal moving away from the receiver (e.g. a mobile handset being operated in a fast car.) In general, we want to present a constant signal level to the analog-to-digital converter (ADC) as this will maximize the signal-to-noise ratio (SNR.) To do this receive signal chains typically use one or more variable gain amplifiers (VGAs) which are controlled by power measurement devices which complete the automatic gain control (AGC) loop. Note that while transmit power control can happen either at RF or IF, receive-side signal processing generally is done at IF.
In both cases, the precision of the signal strength measurement may be critical. For example, consider a base station which transmits an average power of +50 dBm (100 W.) If the detector which regulates the transmitted power from the base station has an unpredictable error over temperature of ±3 dB, it is possible that the base station may at some point be directed to transmit 53 dBm (200 W.) This is clearly unacceptable as it would add excessive cost to the additional thermal dimensioning of the unit.
On the receive side, an imprecise measurement circuit will result in poor leveling of the signal that is presented to the ADC. This will either overdrive the ADC (input signal too large) or waste valuable dynamic range (input signal too small.)
This series deals with many of the issues associated with measuring and controlling RF power levels. Various power measurement techniques such as diode, thermal, rms-to-dc and log amps will be examined. Issues such as response time, dynamic range, resolution, varying crest factor, temperature stability, size and cost will also be examined.
Power
Power in Watts can be expressed in a number of ways, i.e.
![]()
where V is the rms voltage, I is the rms current and R is the resistance in which the power is dissipated. Since most communications systems have constant load and source impedances, usually 50 Ω, it follows that we only need to know the rms voltage to calculate the power. As a result, many practical power measurement circuits rely on measuring rms voltage.
Converting Between dBm, dBmV, W, RMS and Peak-to-Peak Voltage
Signal levels in wired communications applications are usually specified in dBm. However for those "power" detectors which are voltage responding, we really should specify the output voltage with respect to its input voltage. This can be quite confusing for people who live in a dB world. The matter is further complicated by the changing response of many detectors in the presence of a changing peak-to-average ratio on the input signal.
The dBm unit is defined as the power level in dB referenced to 1 mW, i.e.
![]()
where the power is specified in watts.
Since power in watts is equal to the rms voltage squared, divided by impedance, we can also write this as

It follows that 0 dBm is equal to 1 mW, +10 dBm is equal to 10 mW, +30 dBm is equal to 1 W, etc. Because impedance is a component of this equation, we should generally specify line impedance when talking about dBm levels (e.g. 20 dBm: Re 50 Ω.)
The dBV unit is defined as the voltage level, in dB, referenced to 1 Vrms, i.e.
![]()
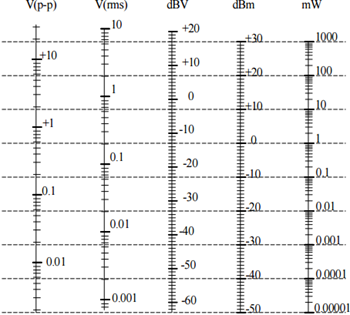
Therefore, 0 dBV is equal to 1 Vrms. Fig. 2 shows how rms volts, peak-to-peak volts , dBV, dBm and mW relate to each other. This is however only valid for a load impedance of 50 and a crest factor of 1.4142 (i.e. a sine wave where Vrms = Vpeak- peak/2/1.4142.) Note that in a 50 system, there is a constant offset of 13 dB between dBV and dBm (dBm = dBV + 13.)

Fig. 2: Converting between Power and Voltage
Definition of RMS1
RMS (or root-mean-square) is a fundamental measurement of the magnitude of an ac signal. Its definition can be both practical and mathematical. Defined practically: The rms value assigned to an ac signal is the amount of dc required to produce an equivalent amount of heat in the same load. For example, an ac signal of 1 Vrms will produce the same amount of heat in a resistor as a 1 Vdc signal. Defined mathematically, the rms value of a voltage is,
![]()
This involves squaring the signal, taking the average, and obtaining the square root. The averaging time must be sufficiently long to allow filtering at the lowest frequencies of operation desired.
Definition of Crest Factor
The crest factor of a waveform is the ratio if its peak value to its rms value. Signals such as amplitude-symmetrical square waves, or dc levels, have a crest factor of one. Other waveforms, more complex in nature, have higher crest factors. A sine wave has a crest factor of 2 (i.e. 1.4142.) So a sine wave with an rms level of 1 V has a peak-to-peak amplitude of 2.8284 V.)
Signal Magnitude Measurement Techniques
I Diode Detection
Fig. 3 shows the schematic of a popular diode detection circuit. This is a simple half- wave rectifier with output filtering. A 68 resistor at the input creates a nominal 50 input match.

Fig. 3: A Simple Diode Detector 2
Fig. 4 shows the output voltage as a function of input signal in dBm.

Fig. 4: Vout Vs. Pin for a simple diode detector circuit
While the transfer function of this circuit at 25° C is reasonably linear, performance degrades significantly at low input levels and over temperature. Fig. 5 shows a modified diode detector circuit which incorporates some temperature compensation. In this circuit the temperature dependence of the diode voltage is compensated by a second diode. So as the voltage drop across D1 increases with temperature, an identical voltage is maintained across D2. This keeps the voltage at the center of the resistor divider, which is used as an output, constant.

Fig. 5: A Temperature-Compensated Diode Detector 2

Fig. 6: Vout and Error Vs. Pin for a Temperature-Compensated Diode Detector
Fig. 6 shows the transfer function of this temperature-compensated circuit. To take a closer look at the improved linearity and temperature stability linear regression can calculate the best straight-line fit for these points; that is, an equation with the form,
![]()
Note that in order to make this calculation, it is necessary to convert power numbers in dBm to voltage (a voltage in/voltage out transfer function gives a nominally linear relationship.) Using this ideal straight line we can plot the linearity of the response over its dynamic range. In practical applications we would like to calibrate the circuit at room temperature but not over temperature. Therefore we calculate the error over temperature with respect to the best straight line, measured at room temperature. This gives us a good measure of the system-level precision of this solution.
Fig. 6 shows that the temperature-compensated diode detector has good temperature stability at high power levels but still becomes less temperature stable and less linear at low input levels. It is important to note that the circuit's output cannot be loaded with any significant resistance. At low temperatures, this circuit has an extremely high output impedance. In fact driving anything less than a FET buffer amplifier will result in the temperature-compensating algorithm failing, giving performance similar to that in Fig. 4.
Diode detector circuits do not measure true rms signal strength, with the output voltage from these detectors changing as a function of input-signal crest factor, even as the input rms signal strength stays constant (higher crest factor gives lower output voltage.) However, in a system where the signals have a constant crest factor this may not matter as long as the detector has been correctly calibrated. So if a radio link, for example, uses just one modulation scheme (e.g. QPSK), accurate power measurements can be made. However in systems with varying crest factors, such as CDMA or WCDMA, true rms measurements become difficult. One solution to this problem is to use different look-up tables based upon the call loading in the base station (it is the call loading in a particular channel that alters the crest factor.) This, however, requires calibration of the base station for every call loading scenario. The problem gets even worse in multi-carrier systems where the crest factor of multiple carriers is changing independent of one another.
II Thermal Detection
Thermal detection essentially involves the practical implementation of the classic definition of rms that we previously looked at. This is the simplest true rms measurement technique in theory; yet in practice it is difficult and expensive to implement. It involves comparing the heating value of an unknown ac signal to the heating value of a known calibrated dc reference voltage (see Fig. 7.) When the calibrated voltage reference is adjusted to null the temperature difference between the reference resistor (R2) and the signal resistor (R1), the power dissipated in these two matched resistors will be equal. Therefore, by the basic definition of rms, the value of the dc reference voltage will equal the rms value of the unknown signal voltage.

Fig. 7: Thermal Detection
Each thermal unit contains a stable, low-TC resistor (R1,R2) which is in thermal contact with a linear temperature-to-voltage converter (S1,S2) an example of which would be a thermocouple. The output voltage of S1/S2 varies in proportion to the mean square of Vin; the first order temperature/voltage ratio will vary as K Vin/R1.
The circuit of Fig. 7 typically has very low error (approximately 0.1%) as well as wide bandwidth. However, the fixed time constant of the thermal unit (R1S1, R2S2) limits the low frequency effectiveness of this rms computational scheme.
In addition to this basic type, there are also variable gain thermal converters available which can overcome the dynamic range limitations of fixed-gain converters at the expense of increased complexity and cost.
[Part II of this series will introduce log amps and detail how they can be used in control loops.]
About the Authors
Related to this Article
Products
DC-Coupled Demodulating 120 MHz Logarithmic Amplifier
250 MHz Demodulating Logarithmic Amplifier
1 MHz TO 4 GHz, 80 dB Logarithmic Detector / Controller
Low Cost, DC to 500 MHz, 92 dB Logarithmic Amplifier
50 dB GSM PA Controller
LF–2.7 GHz RF/IF Gain and Phase Detector


