Abstract
This application note on clock (CLK) signal quality describes the relationship between jitter and phase-noise spectrum and how to convert the phase-noise spectrum to jitter.
Clock (CLK) signals are required in almost every integrated circuit or electrical system. In today's world, digital data is processed or transmitted at higher and higher speeds, while the conversions between analog and digital signals are done at higher resolutions and higher data rates. These functions require engineers to pay special attention to the quality of clock signals.
Clock quality is usually described by jitter or phase-noise measurements. The often-used jitter measurements are period jitter, cycle-to-cycle jitter, and absolute, otherwise known as phase or Time Interval Error jitter. Clock phase-noise measurement examines the spectrum of the clock signal.
This article first briefly reviews the measurement setups for clock jitter and phase noise. The relationship between jitter and the phase-noise spectrum is then described. Finally, a simple equation to convert the phase-noise spectrum to jitter is presented.
Jitter and Phase Noise: Definition and Measurement
Period Jitter
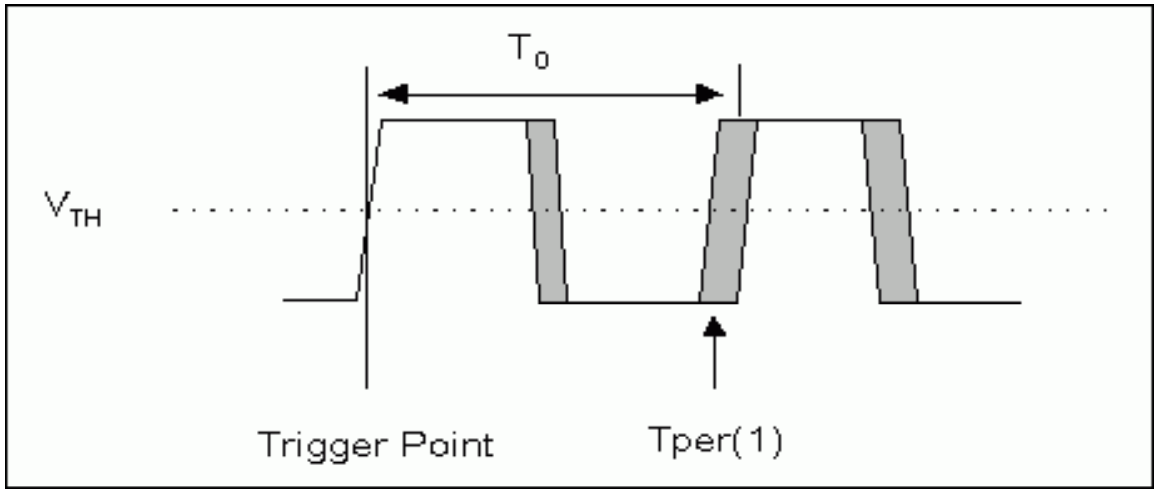
Period jitter (JPER) is the time difference between a measured cycle period and the ideal cycle period. Due to its random nature, this jitter can be measured peak-to-peak or by root of mean square (RMS). We begin by defining the clock rising-edge crossing point at the threshold VTH as TPER(n), where n is the time domain index, as shown in Figure 1. Mathematically, we can describe JPER as:

where T0 is the period of the ideal clock cycle. Since the clock frequency is constant, the random quantity JPER must have a zero mean. Thus the RMS of JPER can be calculated by:

where <•> is the expected operation. Figure 1 shows the relation between JPER and TPER in a clock waveform.
Phase-Noise Spectrum
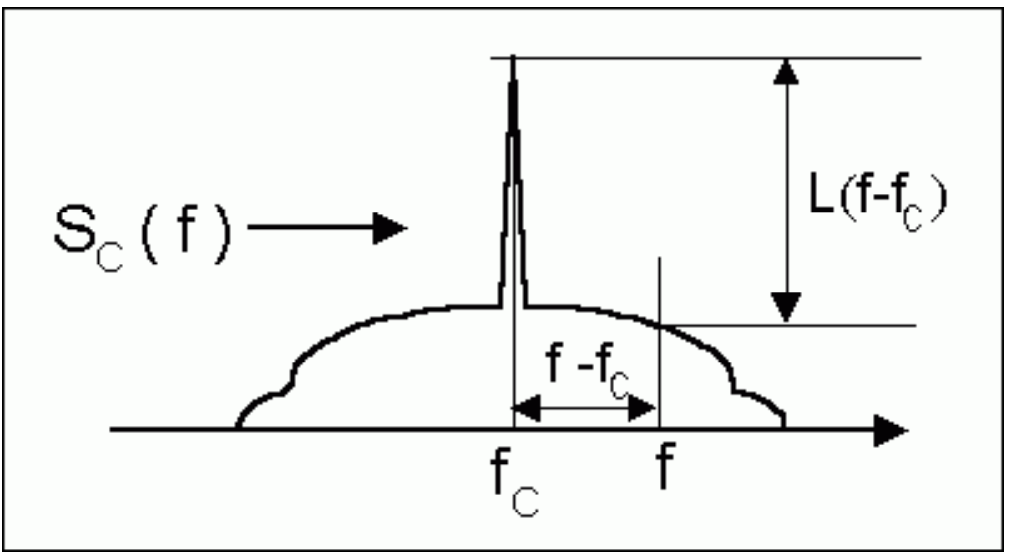
To understand the definition of the phase-noise spectrum L(f), we first define the power spectrum density of a clock signal as SC(f). The SC(f) curve results when we connect the clock signal to a spectrum analyzer. The phase-noise spectrum L(f) is then defined as the attenuation in dB from the peak value of SC(f) at the clock frequency, fC, to a value of SC(f) at f. Figure 2 illustrates the definition of L(f).
Mathematically, the phase-noise spectrum L(f) can be written as:

Remember that L(f) presents the ratio of two spectral amplitudes at the frequencies, fC and f. The meaning of L(f) will be discussed in next section.
Period Jitter (JPER) Measurement
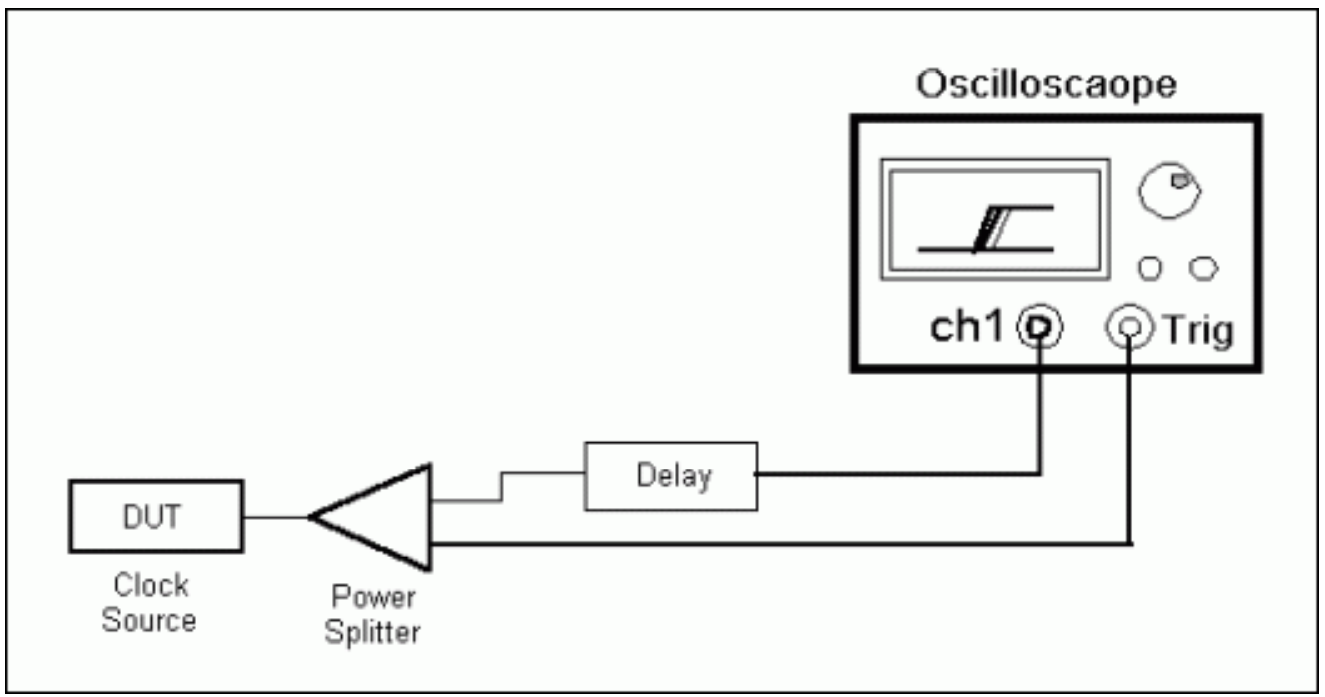
There are different instruments used to measure the period jitter. People most commonly use a high precision digital oscilloscope to conduct the measurement. When the clock jitter is more than 5 times larger than the oscilloscope's triggering jitter, the clock jitter can be acquired by triggering at a clock rising edge and measuring it at the next rising edge. Figure 3 shows a splitter generating the trigger signal from the clock under test. This method eliminates the internal jitter from the clock source in the digital oscilloscope.
It is possible for the duration of scope trigger-delay to be longer than the period of a high-frequency clock. In that case, one must insert a delay unit in the setup that delays the first rising edge after triggering so that it can be seen on the screen.
There are more accurate methods for measuring jitter. Most of these approaches use a post-sampling process of the data sampled from high-speed digital oscilloscopes to estimate the jitter according to the definitions in Equations 1 or 2. This post-sampling approach provides high-precision results, but it can only be performed with high-end digital oscilloscopes [2, 3].
Phase-Noise Spectrum L(f) Measurement
As Equation 1 showed above, L(f) can be measured with a spectrum analyzer directly from the spectrum, SC(f), of the clock signal. This approach, however, is not practical. The value of L(f) is usually larger than 100dBc which exceeds the dynamic range of most spectrum analyzers. Moreover, fC can sometimes be higher than the input-frequency limit of the analyzer. Consequently, the practical way to measure the phase noise uses a setup that eliminates the spectrum energy at fC. This approach is similar to the method of demodulating a passband signal to baseband. Figure 4 illustrates this practical setup and the signal-spectrum changes at different points in the test setup.
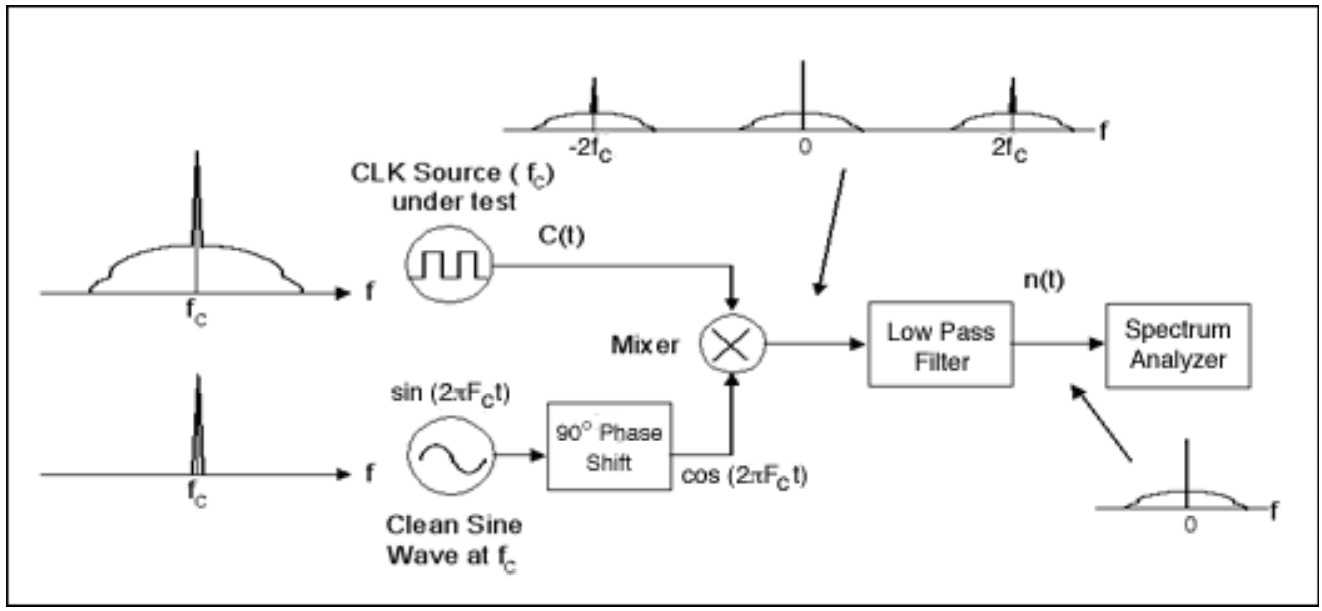
Figure 4. Practical phase-noise measurement setup.
The structure described in Figure 4 is typically called a carrier-suppress demodulator. In Figure 4, n(t) is the input to the spectrum analyzer. We will next show that by scaling down the spectrum of n(t) properly, we can obtain the dBc value of L(f).
Relation between RMS Jitter and Phase Noise
Using the Fourier series expansion, it can be shown that a square-wave clock signal has the same jitter behavior as its fundamental harmonic sinusoid signal. This property makes the jitter analysis of a clock signal much easier. A sinusoid signal of a clock signal with phase noise can be written as:

and the jitter is:

From Equation 2 we see that the sinusoid signal is phase modulated by the phase noise Θ(t). As the phase noise is always much smaller than π/2, Equation 2 can be approximated as:

The spectrum of C(t) is then:

where SΘ(f) is the spectrum of T(t). Using the definition of L(f), we can find:

This illustrates that L(f) is just SΘ(f) presented in dB. This also explains the real meaning of L(f).
We have now shown that the setup in Figure 4 enables the measurement of L(f). Furthermore, one can see that the signal C(t) is mixed with cos(2πfCt) and filtered by the lowpass filter. Thus, we can express the signal n(t) at the input of the spectrum analyzer as:

The spectrum appears on the spectrum analyzer as:

Therefore we can obtain the phase noise spectrum SΘ(f) and L(f):

Then L(f) can be read in dBc directly from the spectrum of n(t) scaled by 4/A².
From Equation 9, the mean square (MS) of Θ(t) can be calculated by:

Following Equation 3 above, we finally show the relationship between the jitter, JABS and the phase noise spectrum, L(f), as:

In some applications like SONET and 10Gb, engineers only monitor the jitter in a certain frequency band. In such a case, the RMS JABS within a certain band can be calculated by:

Approximation of RMS JABS from L(f)
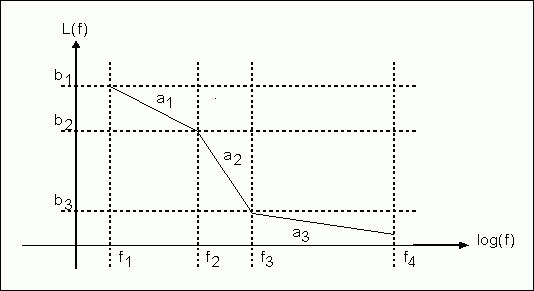
The phase noise usually can be approximated by a linear piece-wise function when the frequency axis of L(f) is in log scale. In such a case, L(f) can be written as:

where K-1 is the number of the pieces of the piece-wise function and U(f) is the step function. See Figure 5.
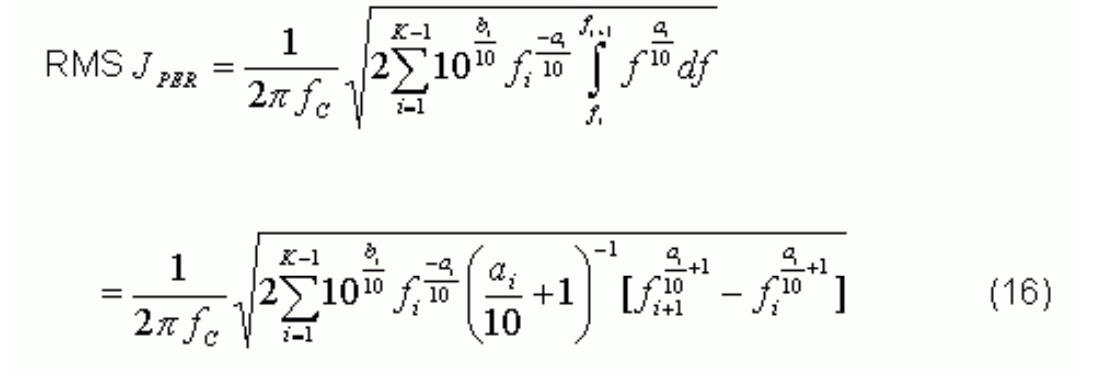
If we substitute L(f) shown in Equation 13 into Equation 12, we have:
To illustrate this, the following table presents a piecewise L(f) function with fC = 155.52MHz.
| Frequency (Hz) | 10 | 1000 | 3000 | 10000 |
| L(f) (dBc) | -58 | -118 | -132 | -137 |
Next we calculate the ai and bi by:

The results are listed in Table 2.
| i | 1 | 2 | 3 | 4 |
| fi (Hz) | 10 | 1000 | 3000 | 10000 |
| ai (dBc/decade) | -30 | -29.34 | -9.5 | N/A |
| bi (dBc) | -58 | -118 | -132 | -137 |
Substituting the Table 2 values into Equation 14, we get:

The RMS jitter of the same clock measured by the setup in Figure 4 at the same band is 4.2258ps. Therefore, the proposed approximation approach for converting phase noise to jitter has proved quite accurate. In this example, the error is less than 4%.
Equation 14 can also be used to estimate the required jitter limit when the phase-noise spectrum envelope is given.
A simple spreadsheet file has been posted with the equation coded as an example.
Summary
This article demonstrates the exact mathematical relationship between jitter measured in time and the phase-noise measured in frequency. Many engineers concerned with signal integrity and system timing frequently question this relationship. The results presented here clearly answer the question. Based on that mathematical relationship, we proposed a method for estimating the jitter from the phase-noise spectrum. Engineers can use this method to quickly establish a quantitative relationship between the two measurements, which will help greatly in the application or design of systems and circuits.
