A source measure unit (SMU) is an instrument that combines a sourcing function and a measurement function on the same pin or connector. It can source voltage or current and simultaneously measure voltage and/or current. It integrates the capabilities of a power supply or function generator, a digital multimeter (DMM) or oscilloscope, a current source, and an electronic load into a single, tightly synchronized instrument.
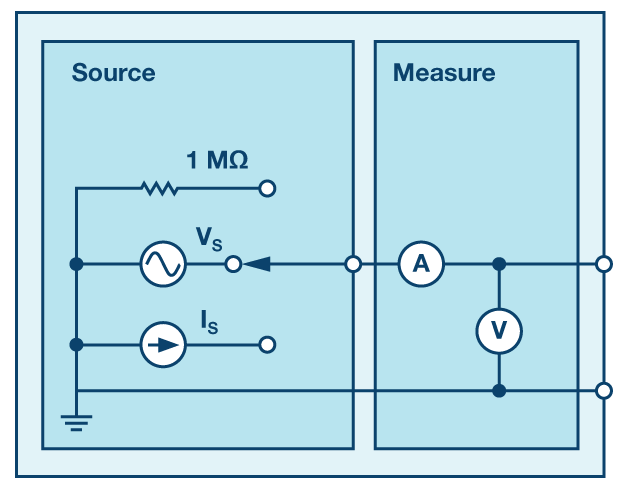
The ADALM1000 is a source measure unit at its heart, but it can also be viewed as a separate oscilloscope and function generator. However, because the output function (generator) and input function (oscilloscope) share a common pin when considered as separate, only one function can be used at a time.
Why Is It Important to Have a Programmable Source Measure Unit?
For some kinds of testing, it might not be important to have a programmable instrument. You may just want to read a value once or a small number of times. However, in many cases, it might be required to collect lots of data so that a plot or graph of the performance over time is generated. However, doing this manually is time-consuming and error-prone.
There are also lots of different experiments that require automated data collection to get faster or more accurate measurements or to take measurements over a long time-scale (months or even years). Here, you will certainly need a computer to collect the data and export it to a database for analysis.
Why Is It Important to Have Negative Voltages?
Not all experiments will need negative voltages and, in some cases, you can avoid this. However, many different types of devices work differently if a positive or a negative voltage is applied. To fully understand how such devices work, we need to be able to change the sign of the voltage applied. Each SMU channel in the ADALM1000 can only produce a voltage from 0 V to 5 V with respect to ground. Fixed 2.5 V and 5 V outputs that can both source and sink current are provided. The DUT could be connected between the 2.5 V output and the SMU output rather than to ground to sweep the voltage across the DUT from –2.5 V to +2.5 V. In addition, because the ADALM1000 has two SMUs, the DUT could be connected between the two SMU outputs. By sweeping one channel from 0 V to 5 V while sweeping the other from 5 V to 0 V, the voltage across the DUT goes from –5 V to +5 V.
As an example, consider a diode—a device that allows electricity to pass through it in only one direction. In order to evaluate if a diode is working, we need to see if it will pass current in both directions. We can do this in one of two ways. We can measure the diode in one direction, manually turn it around and measure it the other direction, and then combine the data sets together. However, we could just measure current flow when we apply both positive and negative voltages. In fact, this technique is so useful it is used to characterize many types of devices that have diode-like behavior—solar cells and light-emitting diodes are both good example cases. Figure 2 shows how to connect a diode to the ADALM1000 to sweep the voltage from –5 V to +5 V.
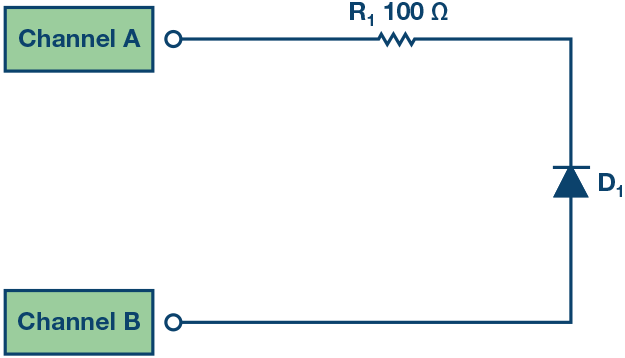
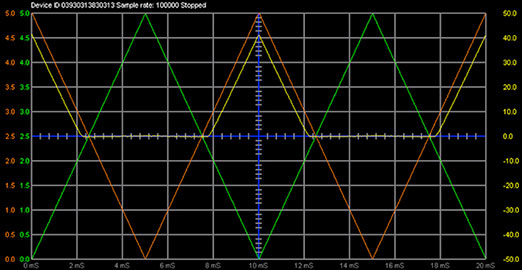
With Channel A programmed to sweep from 0 V to 5 V while Channel B is programmed to sweep from 5 V to 0 V, the difference between the channels appears across the resistor, which is used to limit the current and the diode. The time domain waveforms are shown in Figure 3. The green trace is Channel A voltage, the orange trace is Channel B voltage, and the yellow trace is Channel B current (the Channel A current is not shown, but would simply be the inverse of the Channel B current).
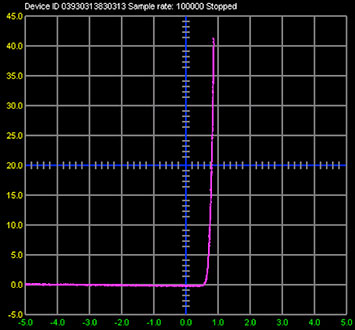
We can plot these measurements vs. each other and perform some simple math at the same time. What we want to plot is the current through the diode vs. the voltage across the diode. To calculate the voltage across the diode, we can subtract the voltage drop across the resistor (V = I × R) fromthe difference between the Channel A and Channel B voltages. The following Python equation (used in ALICE) does that:

Where the 100 is the value of the resistor. The plot of the diode current vs. that equation is shown in Figure 4.
What Are the Uses of a Source Measure Unit?
Many everyday objects will have been tested with an SMU as part of the factory test and quality control process. If you use LEDs to light your home or have solar panels on your roof, these will have been tested with an SMU as part of the manufacturing process.
The ADALM1000 is designed for use by engineering students who are studying the next generation of electronic devices. Understanding how a vast number of materials and devices conduct electricity, ranging from carbon nanotubes and quantum well heterostructures to biomembranes and biosensors, requires an SMU. In short, you can use the ADALM1000 to understand the electrical characteristics of any component at dc or low frequencies over a voltage range from –5 V to +5 V, measuring current from ±0.1 mA to 180 mA.
Can You Give Me a Specific Example of a Measurement That Needs a Source Measure Unit?
Take the example of a solar cell. In research labs, engineers are looking at ways to make more efficient, lower cost solar cells. In order to understand how well a solar cell is working, a small scale test device is produced—perhaps a few square mm to a few square cm in size—and then its performance is characterized. These test cells are too small to generate any usable power beyond lighting, say, a single LED, but they are large enough to characterize the basic operating range and efficiency. This example lab uses the ADALM1000 to measure a small solar cell.
The key characteristic of a solar cell is how efficiently it converts sunlight energy into electrical power. This can be done by illuminating the test cell with a known intensity of light and measuring the electrical power produced per unit area. Since power is voltage multiplied by current, the starting point is to measure the terminal voltage (V) and current produced (I).
The voltage generated can be measured by connecting a voltmeter across the cell terminals while it is illuminated. Similarly, a current can be measured using an ammeter across the cell terminals. If we divide the measured current by the area of the solar cell, we get the current density.
However, there is a problem: if you multiply the voltage by the current (or current density), then this only tells us how much power (or power per unit area) we can generate if we had an ideal device. The reason is that a voltmeter has a nearly infinite internal resistance, and when we measure the voltage by itself, no current will be flowing. In this case, there is zero power being generated (measured voltage × zero current = zero). This measurement is called the open-circuit voltage. Similarly, when we place the ammeter across the terminals to measure the current, we are testing the cell when it has been short circuited, because an ammeter should have nearly zero internal resistance. In this case, there is current flowing but no applied voltage. Again, there is no power generated (measured current × zero voltage = zero). This measurement is called the short-circuit current.
For any practical (real) solar cell, the voltage that it outputs will depend upon how much current is being produced and this is why an SMU is used— so that the voltage can be varied while measuring the change in current.
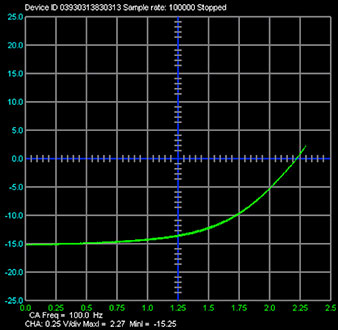
The graph in Figure 5 shows a typical IV curve for a particular small solar cell (in this case, a 3 cm × 3 cm solar cell from a solar garden light). The current is negative because the current is going into (sunk by) the SMU channel. The current at 0 V is the short-circuit current and the voltage at 0 current is the open-circuit voltage.
The IV curve tells us how the voltage and current change and allows us to calculate the actual amount of power that a solar cell generates. Figure 6 plots the power in mW vs. the voltage across the cell. The power is simply V × I. The following Python equation calculates the power in mW:

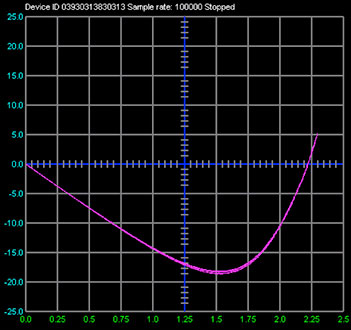
The peak of the graph is the point at which maximum power is generated (the so-called maximum power point). The power is negative because the SMU is absorbing the power produced by the cell.
If we used the technique from Figure 2, we could also measure the solar cell when a negative voltage is applied (reverse bias). This gives us some useful information. Firstly, it tells us that the device doesn’t break down under reverse bias. This is a sign that the device is of good quality. Secondly, it tells us whether there is any extra current available. By applying a negative voltage, we can effectively suck charges out of the device that wouldn’t otherwise be extracted. While these sucked charges can’t be used to generate power (we’re actually putting power into the device at this point, rather than extracting it), it allows us to understand some of the photo current loss mechanisms. Thus, measuring IV curves is one of the most important tools used in solar cell development and optimization. Similarly, taking IV curves is extremely important to understanding a wide range of other device types, including LEDs and OLEDs, transistors, sensors, and many more other devices.
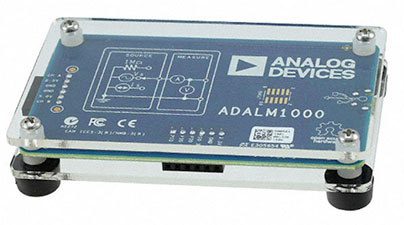
Starting with this article, we will begin a monthly series around the SMU ADLAM100 and show some interesting experiments with it. In case you want to follow the experiments and are interested in the ADALM1000, you could get them from our distributors: DigiKey and Mouser.
Quiz:
Question 1:
In Figure 5, the maximum power of a solar cell is given. Which physical
size has an influence?
Question 2:
What is the maximum power you could get out of the solar cell?
Question 3:
How is the function called to keep the output power at the maximum level?
(Tip: see ADP5091)
You can find the answers at the StudentZone blog.

