摘要
Input and output noise in buck (step-down) converters can concern the system designer. This application note provides a theoretical explanation of the individual contributions of conducted noise on the input and output sides of buck converters. These equations will allow the power-supply designer to optimize components for noise immunity.
Introduction
This application note gives a brief explanation of the individual contributions of conducted noise on the input and output sides of buck (step-down) converters. Equations are listed to help calculate the peak-to-peak noise contributions of each noise source. These equations will allow the designer to select components that meet their design objectives.
Assumptions
The equations listed in this application note are appropriate for any buck converter, independent of the control scheme, as long as the converter meets the following limitations:
-
The equations assume continuous conduction above 0A.
-
The load is a constant DC load.
-
The converter is 100% efficient.
This assumption describes the current flow in the inductor. Depending on the components used and on the load and the topology of the buck converter, the current flow through the inductor can look like that shown in Figure 1. The middle graph of Figure 1 (Graph B) shows discontinuous current flow. Discontinuous current flow occurs when the current through the inductor tries to go negative (i.e., current flows out of the output capacitor and into ground), but gets clamped at zero. Discontinuous conduction typically, but not always, occurs under light-load conditions.
The bottom graph of Figure 1 (Graph C) shows an example of continuous conduction where the current through the inductor drops below 0A. For the current to drop below 0A, the converter must have synchronous rectification and be designed to allow for that type of operation. With such a converter the current will typically, but not always, go below 0A under light-load conditions.
Whether the converter is synchronously rectified or not, continuous conduction above 0A will tend to happen at higher loads, as shown in the top graph in Figure 1. Thus, the equations listed in this application note should be appropriate when the converter is operating close to maximum loading.
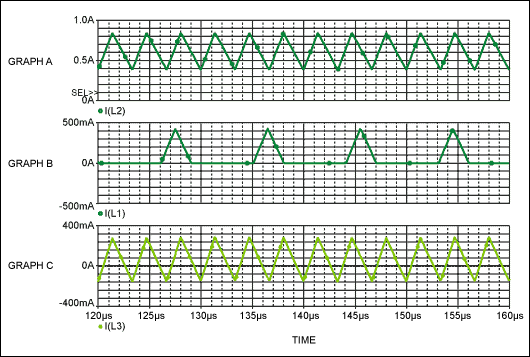
Figure 1. Three possible waveforms are shown for the current flowing through the inductor in a buck converter. Graph A shows continuous conduction operation where the current never drops below 0A. Graph B shows discontinuous conduction. Graph C shows continuous conduction where the current drops below 0A.
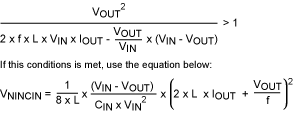
Use Equation 1 below to test a particular design. If this inequality is met, the converter is operating in continuous conduction above 0A and the first assumption is satisfied.

VIN = the buck regulator's input voltage
VOUT = the buck regulator's output voltage
f = the frequency at which the buck regulator is switching
L = the value of the inductor
IOUT = the output current
This assumption needs to be made for practical reasons. While assumption 1 is a reasonable assumption for most applications, this second assumption is most likely not true. In a typical buck-converter application, the current draw of the load will fluctuate. This fluctuation will cause noise, due to the finite response time of the converter and the equivalent series resistance (ESR) of the output capacitor (explained later), among other things. To calculate the output noise due to this fluctuation, the characteristics of the load need to be known. That is, of course, impossible for this application note.
This again is a practical consideration. The equations would be unwieldy if this assumption was not made. Most modern buck converters have excellent efficiency and the amount of error introduced by this assumption is minimal.
Background
Some of the noise sources in buck converters come from the nonideal properties of the components used. To better understand these noise sources, a brief discussion of the nonideal aspects of components follows. To keep this discussion simple, only the nonideal properties relative to buck converters are discussed.
Model for MOSFETs
When discussing a buck converter, a first-order model for a MOSFET is a switch in series with a resistance, as shown in Figure 2. In this model, the MOSFET has a finite resistance between its drain and its source when the MOSFET is turned on. Typical RON (on resistances) can vary widely depending on the MOSFET and the application. As a point of reference, the IRF7303 used on the MAX1653EVKIT (evaluation kit) has a typical RON of 6.08Ω (VGS = 4.5V).
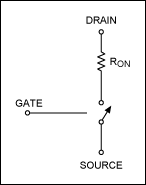
Figure 2. A first-order model of a MOSFET used in a buck converter.
A more complete model for a MOSFET is shown in Figure 3.
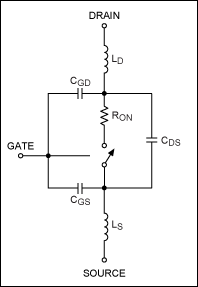
Figure 3. A more detailed model of a MOSFET used in a buck converter.
This model adds inductances and capacitances to the first-order model in Figure 2. The three capacitors shown are:
- CGD = Capacitance from the gate to the drain
- CGS = Capacitance from the gate to the source
- CDS = Capacitance from the drain to the source
Again, using the IRF7303 as an example, typical values for these capacitances are listed below (VDS = 8V):
- CGD = 120pF
- CGS = 470pF
- CDS = 180pF
In addition to these capacitances, both the drain and the source of the MOSFET have equivalent internal series inductances, LD and LS. The drain and source inductances are listed in the data sheet of the IRF7303 as 4nH and 6nH, respectively.
Model for Capacitors
The model for a capacitor is shown in Figure 4.

Figure 4. A model for capacitors used in buck converters.
All capacitors have what looks like a resistor in series with its capacitance. This resistor is referred to as the equivalent series resistance (ESR) of the capacitor. ESR varies significantly with the type of capacitor used. Ceramic capacitors typically have very low ESR; the average aluminum electrolytic capacitor can have high values of ESR; and tantalums capacitor EST values fall somewhere in between. In recent years, there have been a number of specialty capacitors designed to minimize ESR. Below is a listing of some examples:
- AVX TPS series. Example: 10V, 100µF capacitor with an ESR as low as 0.065Ω at 100kHz
- Kemet® A700 series. Example: 6.3V, 100µF capacitor with an ESR as low as 0.03Ω (max) at 100kHz
- Panasonic® ECJ series. Example: 16V, 4.7µF capacitor with an ESR as low as 0.017Ω (max) at 100kHz
Note that the ESR of a capacitor varies with frequency.
Also in this model is the equivalent series inductance (ESL) of the capacitor. Some typical inductances for ceramic chip capacitors are listed below:
- 0.1µF at 1.7nH
- 0.01µF at .84nH
- 1000pF at 1.7nH
Values for tantalum and aluminum capacitors are more difficult to specify, but are probably on the order of 5nH to 10nH for a good high-value, surface-mount device.
Model for a Reversed-Bias Diode

Figure 5. A model for reversed-biased diode used in a buck converter.
The catch diode used on some buck converters can be modeled as an inductance in series with a capacitor when reversed biased. The MBR030 used on the MAX1653 evaluation board has a capacitance of approximately 55pF when reversed biased with 8V. This capacitance varies significantly with bias voltage. The inductance is not listed in the data sheet, but is probably on the order of 1nH to 2nH.
Model for Circuit-Board Traces
Even the traces on circuit boards are not perfect. For our discussion, we will model the traces on the circuit boards as inductances.
Output Noise
Figure 6 shows a typical buck converter, with Figure 7 showing some typical waveforms for that converter. Graph D in Figure 7, labeled I(COUT), shows the current flowing into and out of the output capacitor. Note that the net DC current is zero (because it is a capacitor), but that there is AC current flowing.

Figure 6. A typical buck converter circuit. Note that, depending on the buck converter used, the low-side MOSFET and or the catch diode may not be used.

Figure 7. Shown are some typical waveforms for a buck converter. Graph A, I(L), shows the current waveform through the inductor. Graph B, I(CIN), shows the current flow through the input capacitor. Graph C, V(CIN1:1) shows the noise at the input of the converter that is due to the ESR of the input capacitor. Graph D, I(COUT), shows the current through the output capacitor. Graph E, V(COUT:1), shows the noise on the output of the converter, due to the ESR of the output capacitor.
This AC current working against the output capacitor's finite capacitance and ESR generates the output noise.
The first noise source we will discuss is finite output capacitance. Assuming for the moment that the output capacitor is ideal and that there is no ESR, the voltage on the capacitor is given by the age-old capacitor equation, V = I/C∫idt. With a little math, this formula can be represented as Equation 2. Equation 2 calculates the peak-to-peak output noise due to a finite output capacitance. It is interesting to note that the output noise is independent of the load current.

VIN = the buck regulator's input voltage
VOUT = the buck regulator's output voltage
f = the frequency at which the buck regulator is switching
COUT = the capcitance of the output capacitor
L = the value of the inductor
RCOUTESR = the ESR of the output capacitor
VNOUTESR = the peak-to-peak noise voltage due to the finite capacitance of the output capacitor
Figure 8 shows the output waveform measured using a MAX1653EVKIT with high-quality ceramic capacitors that have negligible ESR. The output ripple that looks like a sin wave is due mostly to finite output capacitance.

Figure 8. The noise on the output of a MAX1653EVKIT, using two 4.7µF ceramic capacitors. The measured peak-to-peak noise of 20mV agrees well with the calculated 18mV peak-to-peak.
Minimizing this source of noise is academically simple: just increase the value of the output capacitance. If there were no ESR, this would truly be the case. However, choosing a larger capacitor can, under some circumstances, actually increase the output noise if the ESR of the capacitor is larger.
Output Capacitor ESR
The contribution to the noise from the ESR of the output capacitor is easy to calculate. The peak-to-peak noise is given by VP-P = di × RESR, where di is the peak-to-peak AC current going into the capacitor. Again, with a little mathematics, this equation can be expressed as shown in Equation 3. This equation gives the peak-to-peak noise due solely to the output capacitor's ESR.

VIN = the buck regulator's input voltage
VOUT = the buck regulator's output voltage
f = the frequency at which the buck regulator is switching
L = the value of the inductor
RCOUTESR = the ESR of the output capacitor
VNOUTESR = the peak-to-peak noise voltage due to the ESR of the output capacitor
Choosing the correct output capacitor is critical for a low-noise design. The correct capacitor balances cost, low ESR, and high capacitance.
Input Noise
Many times engineers calculate the output noise, while ignoring the input noise. Buck converters will also cause conducted noise to be "injected" onto the input supply. For example, in the case of a 5V to 3.3V converter, the buck converter will cause noise on the 5V supply as well as generate noise on the 3.3V output. If the 5V supply has noise-sensitive components powered from it, this injected noise could be important. The section below describes what causes this noise. There are basically three major contributors: finite input capacitance, the ESR of the input capacitor, and ringing caused by the stray inductance and stray capacitance in the circuit.
Input Capacitor Capacitance
The current waveform that the input capacitor "sees" is shown in Graph B of Figure 7. This AC current works against the input capacitor's finite capacitance to create noise on the input supply. This noise is calculated in the same way as the noise on the output due to finite capacitance. Again, we start with the basic capacitor equation, V = I/C∫idt. Putting this equation into a form we can use yields the equations listed below (Equation 4). When making this calculation, be sure to include all the capacitances on the input supply, and not just the capacitance physically located next to the buck converter.

VIN = the buck regulator's input voltage
VOUT = the buck regulator's output voltage
f = the frequency at which the buck regulator is switching
L = the value of the inductor
IOUT = the output current
VNINCIN = the peak-to-peak noise voltage due to the finite capacitance of the input capacitor
CIN = the capacitance of the input capacitor
Figure 9 shows a typical waveform of the noise from finite input capacitance. This plot was taken with high-quality ceramic capacitors that minimize any effect due to capacitor ESR. The large, high-frequency noise is unrelated to the finite input capacitance and is caused by the capacitor's ESL. This is discussed further under the section Input Capacitor's ESL.
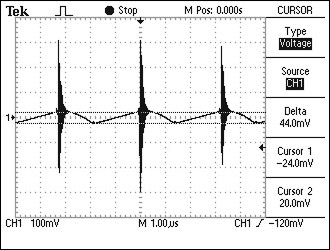
Figure 9. Shows a typical waveform of noise from finite input capacitance.
Input Capacitor ESR
The contribution to the noise by the input capacitor's ESR is calculated using the same method used for the output capacitor. This peak-to-peak noise is given by VP-P - di × RESR, where di is the peak-to-peak AC current going into the capacitor. Equation 5 is the same basic formula, but with variables that are directly related to the circuit. Figure 10 shows a typical waveform generated from an input capacitor's ESR. Again, the large high-frequency noise is due to the stray inductance and capacitance in the circuit; it should be ignored in the discussion of ESR noise. Noise from stray inductance will be discussed later.

VIN = the buck regulator's input voltage
VOUT = the buck regulator's output voltage
f = the frequency at which the buck regulator is switching
L = the value of the inductor
IOUT = the DC output current
RCINESR = the input capacitor's ESR
VNINESR = the peak-to-peak noise voltage from the ESR of the input capacitor
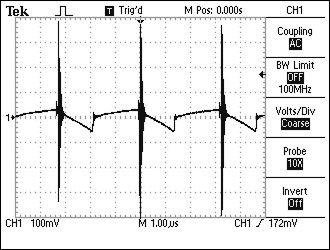
Figure 10. Shows the noise on the input due to the input capacitor's ESR.
Input Capacitance ESL
Figure 10 shows the noise on the input of a MAX1653EVKIT. Notice that there is some high-frequency noise at the points where the MOSFET switches. This noise is shown on an expanded time scale in Figure 11.
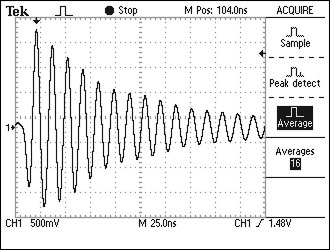
Figure 11. An expanded view of the high-frequency noise on the input supply of a buck converter.
While the noise contributions from the input capacitance and ESR are fairly intuitive, this noise source is much less obvious. We can redraw the typical synchronous buck converter shown in Figure 6 to include all the nonideal components, e.g., the MOSFETS, catch diode, input capacitor and traces (Figure 12).
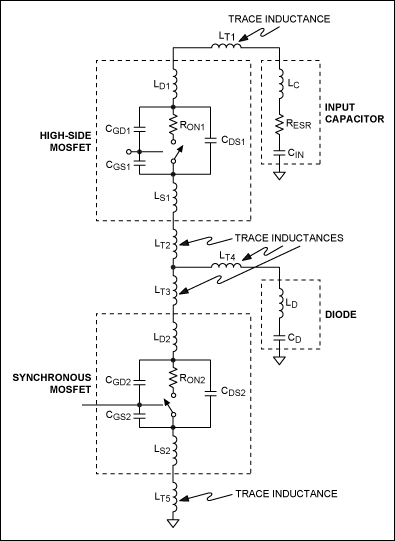
Figure 12. Shows the input side of a buck converter using the models developed earlier in this application note.
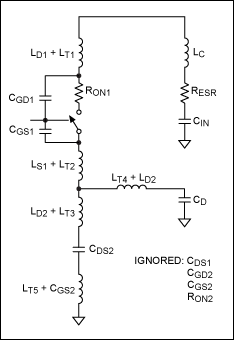
Figure 13. A simplified version of Figure 12 where some components are combined and trivial components are ignored.
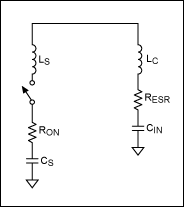
Figure 14. A further simplification of Figure 12. Technical accuracy of this drawing was sacrificed for simplicity.
Figure 12 can be simplified into Figure 13 by combining components and discarding parts that have negligible contributions. By taking some aggressive liberties, a further simplification of the circuit can be made to give Figure 14. While these aggressive liberties are not technically "accurate," they are necessary to simplify understanding and the equations. With our newly simplified circuit, it now becomes obvious that there is a series RLC tank circuit. When the switch closes, this tank circuit resonates in a classic manner. A series RLC circuit has a response as shown in Figure 15.

Figure 15. The ideal waveform of Figure 14 when the switch is closed. This waveform assumes that the input voltage (initial value of the capacitor) is 8V.
The equations that govern this RLC circuit with respect to our simplified model are given below:


When the buck converter uses an n-channel MOSFET on the high side, the variables given in the above equations can be defined as:
VP-P = the maximum peak-to-peak noise voltage
LS = Lt1 + Lq1d + Lq1s + Lt2 + Lt3 + Lq2s + Lq2s + Lt4
LC = the equivalent series inductance of the input capacitor
VIN = the buck regulator's input voltage
τ = the ring-down time constant
RESR = the ESR of the input capacitor
RON = the on-resistance of the high-side MOSFET
CS = Cq2DS + Cq2GD
The case where a p-channel MOSFET is used on the high side is not as simple. When an n-channel MOSFET is used, the capacitance of the high-side switch can be ignored. This is because a floating gate driver is used, and it basically shorts out most of the high-side MOSFET's capacitances. In the case of a p-channel MOSFET, a floating gate driver is not used, and the capacitances cannot be ignored. Therefore, our aggressive oversimplification of the circuit is not as nearly as accurate in the case of a p-channel supply as it is for an n-channel supply. However, the basic concepts and the solutions are the same.
To check the relative accuracy of our simplified circuit in Figure 14, we compare the response of the MAX1653EVKIT (Figure 11) with the ideal waveform (Figure 15). The ideal waveform was generated using values obtained from the typical components used on the MAX1653 EV board. The MAX1653EVKIT is ideal for comparison purposes, because it uses a high-side n-MOSFET.
The first thing to notice is that the first low-going cycle on the EV kit is not as big as that predicted by our simple model. This is primarily because of the finite turn-on time of the MOSFET: the MOSFET does not instantaneously go from high impedance to low impedance. This transition takes time. In the case of the MAX1653EVKIT, this transition is on the order of 5ns to 15ns. Because this transition time is roughly on the same order as the period of our ringing, the first cycle gets attenuated. This works in our favor to reduce the peak-to-peak noise. Consequently, except for the first low-going cycle, our simplified model matches the lab results as well as can be expected.
Now that we understand the source of this ringing, how do we minimize it? Looking at Equation 6, we find that the noise is based on three variables: the input voltage (over which we have little control), the input capacitor's series inductance, and the sum of the inductances in the circuit. It becomes obvious (both mathematically and intuitively) to use input capacitors that have small series inductances. In addition, placing a small, low-inductance ceramic chip capacitor in parallel with the bulk capacitance can reduce the size of this noise. Keep these capacitors as close as possible to the MOSFETs (and/or catch diode). See Figure 16. A .01µF ceramic chip capacitor tends to be ideal in terms of capacitance and low inductance. In addition to placing the .01µF capacitors at the input of the buck converter, placing these capacitors close to sensitive circuits that use the VIN supply will greatly reduce the noise at these circuits. One might also be tempted to reduce the slew rate of the gate drive to the MOSFET. Although this will reduce the noise, it could have negative effects on other aspects of the buck converter's performance, specifically its efficiency.
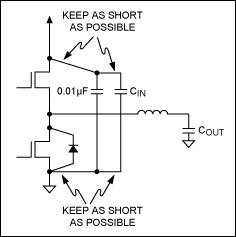
Figure 16. Placing a good ceramic 0.01µF capacitor in parallel with the bulk input capacitance, and placing both capacitors directly across the MOSFETs (or catch diode) will help minimize ringing on the input supply due to the bulk capacitor's ESL.
At this point it is appropriate to mention measuring techniques. Good measurement techniques are a good idea in general, and are critical in trying to measure input-capacitance ESL noise. When using a scope probe, keep the ground lead as short as possible. Connect both the signal portion of the probe and the ground lead directly across what you are trying to measure. Remember that this noise source is due to inductances on the order of nHs. It does not take much trace length to introduce nHs of inductance and ruin your measurement.
If further reduction of this noise source is necessary, some input-supply filtering can virtually eliminate the noise. The simplest and most economical way is to separate the VIN supply from the rest of your circuitry as much as possible. This approach adds a little inductance between the VIN supply and the rest of the circuitry. This extra inductance provides some isolation, thus effectively filtering this noise source. See Figure 17. Placing a small inductor in series with this supply line will virtually eliminate this noise source altogether. An inductor on the order of 200nH to 1µH is probably best. Too large an inductor can have negative effects on circuit behavior. See Figure 18.

Figure 17. Separating the VIN supply into two traces from the main power supply adds some trace inductance, which acts to filter the noise caused by the input capacitor's ESL.
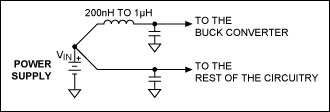
Figure 18. Adding some inductance in series with the buck converter will virtually eliminate the noise from the ESL of the input capacitor.
Summary of Equations
| Noise due to Finite Capacitance | |
| Input Noise |
|
| Output Noise |  |
| Noise due to ESR of Capacitor | |
| Input Noise |  |
| Output Noise |  |
VIN = the buck regulator's input voltage
VOUT = the buck regulator's output voltage
f = the frequency at which the buck regulator is switching
CIN = the capacitance of the input capacitor
COUT = the capacitance of the output capacitor
L = the value of the inductor
IOUT = the output current
RCINESR = the input capacitors
RCOUTESR = the ESR of the output capacitor
VNOUTESR = the peak-to-peak noise voltage due to the ESR of the output capacitor
VNOUTC = the peak-to-peak noise voltage due to the finite capacitance of the output capacitor
VNINESR = the peak-to-peak noise voltage due to the ESR of the input capacitor
VNINCIN = the peak-to-peak noise voltage due to the finite capacitance of the input capacitor
Note: The noise from the different sources is not in phase and, therefore, cannot be directly added.

