摘要
Analyzing circuits numerically doesn't mean you have to buy an expensive simulator. With the capabilities of Microsoft® Excel, commonly available on engineers' computers, you can easily do many common circuit calculations. While this won't replace your favorite flavor of SPICE, it can be a powerful tool to solve a dedicated problem or gain intuition.
Setting up a Simulation
The first thing you need to know is how to use Excel's COMPLEX function. The complex function family allows you to work directly with the complex numbers that we need in circuit analysis. For example, let's calculate the input impedance of the circuit in Figure 1. This is the kind of equivalent circuit you might see for a large value electrolytic bypass capacitor.

Figure 1. Simple RC circuit.
The equation for Zin is simply the sum of the impedances of the individual components in series. The derivation of the equations for Zin is shown in Figure 1. Now, to set this up in Excel we build a spreadsheet with entries for the R, the C, and a frequency sweep as shown in Figure 2.

Figure 2. Excel spreadsheet calculates RC impedance.
The equation for Zin is
"=COMPLEX($B$3,1/(2*PI()*$A7*$B$4),";-j";)".
The first parameter is the real part, the second parameter is the imaginary part, and the "j" specifies the standard engineering complex notation where j = √-1. The third and fourth columns use the functions IMABS and IMARGUMENT to convert the complex value in the Zin column into magnitude and phase in degrees. IMARGUMENT produces an answer in radians so convert to degrees by multiplying by 180 and dividing by π.
As expected, the impedance of this circuit is very high and capacitive at low frequencies and decreases to a value equal to the resistance at high frequencies. You can get a quick feel for the effectiveness of a particular bypass capacitor with this kind of analysis.
Non-Ideal Op Amp Simulation
Of course, not all problems are as simple as the one above but we can apply these simple techniques on a harder problem. Let's take a look at calculating the effects of finite open loop gain on an op amp circuit's response. Again this is easy to do in Excel. The circuit in Figure 3 illustrates the problem's setup. Note that the open loop gain is a complex number and in general the feedback network can be made up of complex impedances.

Figure 3. Non-ideal open loop gain op amp.
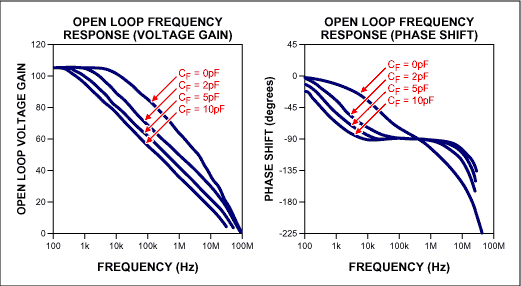
We can get the values of the op amp's open loop gain, AOL(s), from the data sheet. I've chosen to examine the MX3554/BB3554, a 90MHz op amp whose curves are shown in Figure 4. I read key values off the graphs, paying particular attention to extreme values, points of inflection, and the frequencies around where the gain drops off. In the circuit response world things tend to happen linearly on a log-log frequency scale. Any other required points on the curve can be easily interpolated. Data book curves showing voltage gains vs. frequency are commonly expressed in dB magnitude vs. log frequency.

Figure 4. Open loop gain of MX3554/BB3554.
The only tricky part in entering the equations from Figure 3 to use the data from Figure 4 is remembering that instead of the '*/±' operators that Excel uses for scalar numbers we must use their complex equivalents IMPRODUCT, IMDIV, IMADD, and IMSUB. I modeled Zf and Zi as parallel RC circuits to allow me to do compensation calculations. The results are shown in Figure 5 below:
(a) Uncompensated, Gain = -100V/V
(b) Gain = -100V/V, Cf = 0.28pF

Figure 5. Closed loop response of (a) uncompensated and (b) compensated op amp circuit.
In this case I adjusted the feedback capacitor to flatten out the peaking at high frequencies. In other situations you may prefer to adjust for an equiripple version of flat response and extend the frequency range a little further.
Stability
The op amp circuit will be unstable if the output is fed back to the input in phase and with gain. To look at stability we need to look at the loop gain rather than the overall circuit gain. For an inverting op amp configuration, this loop gain is a factor called beta (β), defined in Figure 3, multiplied by -AOL. The plot of

Figure 6. Stability plot.
Note that the feedback gain is well below one when the feedback is in-phase. The gain is also falling rapidly so that when the phase does reach zero at some frequency, off the right side of my graph, the gain will be very low (below 0.1V/V in this case). Phase margin, a stability quality factor defined as the phase when the gain reaches unity, is greater than 45 degrees. This circuit is therefore stable.
Other Ideas
This isn't the end of what you can do with Excel. Here are a few additional ideas:
- Excel has optimization functions you can use to adjust the capacitor automatically to meet your flatness criteria.
- Excel has FFT and IFFT functions. With a little more work these circuits can also give you time domain waveform information. For the RC circuit you could analyze current glitches on a bypassed power line; for the op amp you could look at the waveform's edges and overshoot.
- You can use the random number functions (RAND and RANDBETWEEN) of Excel to simulate manufacturing tolerances and include the effects of PCB strays. Histogram plots can be used to show the results. Other Excel functions will generate random values from your choice of a wide variety of probability distribution functions.


