Charge Efficiency and Cell Aging Effects of the DS2770 Li+ Pulse Charger vs. Linear Chargers
要約
Charging a battery cell can be accomplished using a variety of methods including linear (CC/CV) charging and pulse charging. This application note compares these charge methods with respect to the effect each has on charge efficiency and cell aging. An experiment to study the effect of pulse charging and linear charging on both charge efficiency and cell aging is described. Results are presented that show that the pulse charging method charges battery cells faster and ages the battery cell less than the linear charge method.
Introduction
Pulse-charging topology shares many of the same desirable advantages as linear charging including simplicity, low cost, small size, and few external components. It offers a benefit over linear chargers in that heat is dissipated in the wall adapter instead of the charger itself. However, perceived disadvantages exist which put forth the notion that the pulse charging of a Li+ cell prematurely ages the cell, resulting from subjecting it to the same current during the constant current region and the pulsed region, where it is very near its maximum voltage. However, data taken does not support this theory. A comparison between a linear (CC/CV) charger and the DS2770 Battery Monitor and Pulse Charger will be presented, focusing on the effect of each with respect to charge time, charge capacity, and cell aging.
Charge Time and Cell Aging Experiment
The DS2770 Battery Monitor and Charge Controller, which features a Li+ pulse charger, was used to provide the pulse charge profile and to serve as the coulomb counter for the experiment. The coulomb count was used as a measurement of diminishing capacity as the cell was cycled. Figure 1 illustrates the test setup used for the experiment.
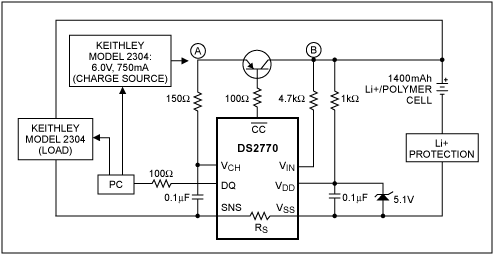
Figure 1. Test setup for linear and pulse charger experiment.
The charge source used was a Keithley Model 2304 power supply. It was set to an open circuit voltage of 6.0V and a current limit of 750mA for the pulse mode cycles. The Keithley was connected to node A in Figure 3 for the pulse mode cycles. The DS2770 charged the cell at the current limit until the cell reached 4.2V, then transitioned into the pulsed phase. Pulse widths (tPULSE) are 875ms (typ) and charge was terminated when tPULSE + tOFF = 14s (typ), a duty cycle of 6.25%. Refer to the DS2770 data sheet for detailed specifications.
For the linear charge cycles, the Keithley was programmed to deliver 750mA at 6.0V during the constant current region. It was connected to node B for the linear cycles, thus bypassing the pulse charger of the DS2770. The DS2770 was used to measure the cell's voltage during the constant current phase and its current during the constant voltage region. When the cell voltage measurement reached 4.2V, the Keithley maintained a constant 4.2V to node B. Charge was terminated and the cell was considered fully charged when the battery current as measured by the DS2770, dropped to 50mA (with the constant 4.2V at node B).
A second Keithley 2304 was used to simulate the load for the discharge cycles. All discharge cycles were done at 25°C and had an identical profile, regardless of the mode used to charge the cell. The load current was set to 750mA DC until the cell voltage decayed to 3.4V. It was then dropped to 250mA DC again until the cell voltage fell to 3.4V. Finally, the load was reduced to 50mA, and the cell was considered fully discharged when the cell voltage fell to 3.4V under 50mA load. The difference in the Accumulation Current Register (ACR) of the DS2770 between the start and end of the discharge period was logged as the usable capacity of the cell for each given charge cycle.
Charging Time and Usable Capacity over Temperature
A brand new 1400mAh Li-Polymer cell was used for the comparison of charge time over temperature for the DS2770 pulse charger and the discrete linear charger. As cell capacities can vary drastically during its first few charge/discharge cycles, this cell was "broken in" by cycling it 10 times before taking any measurements.
The experiment began by charging the fully discharged cell by the DS2770 pulse charger at 40°C. The time (using PC clock) duration between start and end of charge was logged. The chamber was then returned to 25°C, and the cell was fully discharged using the profile and "empty" criteria described earlier. The ACR difference from start to end of discharge was logged as the usable capacity of the cell under that charge profile at that temperature. The cell was then charged using the linear profile at 40°C, again logging charge time. It was discharged at 25°C, recording delta ACR. This process was repeated at charge cycle temperatures ranging from 0°C to 40°C in 5°C increments, and the results are graphed in Figures 2 and 3.
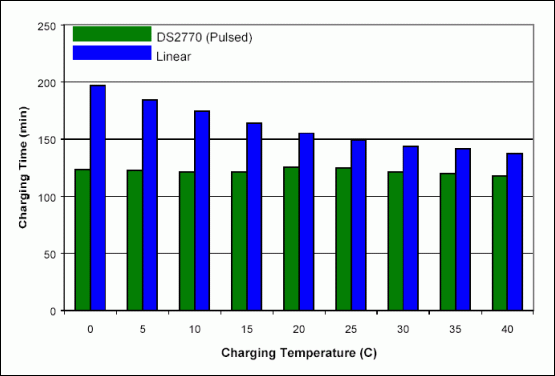
Figure 2. Charge time for pulsed and linear charger over charging temperature.
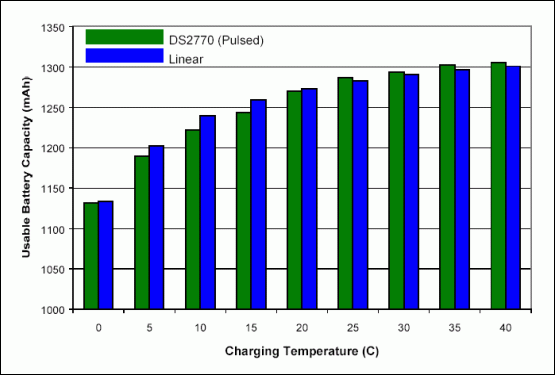
Figure 3. Usable cell capacity for pulsed and linear charger over charging temperature.
Usable capacity is virtually the same for the two charging topologies at a given temperature, with the pulse charger being slightly better at high temperatures and the opposite for linear. The difference in charging time, however, is rather significant. At low temperatures charge time was 37% longer with the constant voltage top-off than for the pulsed mode top-off. At 40°C, the pulse charger was 14% faster. These results show that the pulsed mode charger will charge the cell significantly faster, but despite the shorter time, charge the cell with virtually the same usable capacity as the linear charger.
Cell Aging Comparison between Linear and Pulsed Charger
With faster charge time demonstrated for pulse chargers, the next measurement to address is the aging effect of the cell relative to linear mode charging. Two brand new 1400mAh Li-Polymer cells were cycled 10 times to break them in. One cell was submitted to 500 charge/discharge cycles at 25°C under a linear profile and the other cell charged by the DS2770 pulse charger. The discharge profile was the same as described for the charge time experiment. Cell aging was based on decreasing usable capacity, as measured by the DS2770 ACR difference before and after each discharge cycle. Results of the experiment presented as a percentage of the usable capacity at the first discharge is shown in Figure 4.
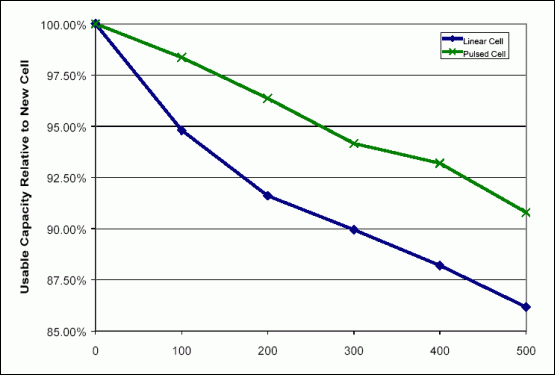
Figure 4. Cell aging for linear and pulsed chargers.
This experiment demonstrates that the aging effect from pulse mode charging is actually less than that of the linear mode. The cell cycled with the CC/CV profile had 4.6% less usable capacity than the pulse charger after 500 charge/discharge cycles at 25°C.
Conclusion
Linear and pulsed-mode Li+ chargers both share many advantages including simplicity, low cost, small size, and few external components. The linear charger dissipates power in the pass element in the battery pack, requiring the pack designer to make accommodations to manage the resulting heat. The pulse charger requires a current limited charge source, but that allows the power to be dissipated in the charge source and not the battery pack. A perceived disadvantage of the pulse charge profile is aging of the cell as a result of pulsing 1C charge current with the cell at VCV. Using the DS2770 Battery Monitor and Charge Controller, experiments were presented to demonstrate a.) the pulse charger charges the cell 16% faster than the linear charger at 25°C with roughly equal usable capacity and b.) the pulse charger actually ages the cell 4.6% less than the linear charger after 500 charge/discharge cycles at 25°C.


