Design Note 229: Don't Be Fooled By Voltage Reference Long-Term Drift and Hysteresis
The new micropower LT1461 and LT1790 low dropout bandgap voltage references excel not only in temperature coefficient and accuracy, but also in long-term drift and hysteresis (output voltage shift due to temperature cycling). Long-term drift and hysteresis, which are sometimes ignored or wrongly specified by other manufacturers, can be the accuracy limitations of systems. System calibrations can remove TC and initial accuracy errors, but only frequent calibration can remove the long-term drift and hysteresis. Subsurface Zener references, like the LT1236, have the best long-term drift and hysteresis, but they do not offer low output voltage options, low supply current and low operating supplies like these new bandgap references.
Lies About Long-Term Drift
Some manufacturers are now touting phenomenal long-term drift specifications, based on accelerated high temperature testing. THIS IS A DELIBERATE LIE! Long-term drift cannot be extrapolated from accelerated high temperature testing. The only way long-term drift can be determined is to measure it over the time interval of interest. The erroneous technique produces numbers that are wildly optimistic and uses the Arrhenius Equation to derive an acceleration factor from elevated temperature readings. The equation is:

where:
EA = Activation Energy (Assume 0.7)
K = Boltzmann’s Constant
T2 = Test Condition in °Kelvin
T1 = Use Condition Temperature in °Kelvin
To show how absurd this technique is, compare this calculation to real LT1461 data. Typical 1000 hour long-term drift at 30°C = 60ppm. The typical 1000 hour long-term drift at 130°C is 120ppm. From the Arrhenius Equation the acceleration factor is 767 and the projected “bogus” long-term drift is 0.156ppm/1000hr at 30°C. For a 2.5V reference, this corresponds to a 0.39μV shift after 1000 hours. This is pretty hard to determine (read impossible) if the peak-to-peak output noise is larger than this number. As a practical matter, one of the best laboratory references available has long-term drift of 1.5μV/mo. This performance is only available from the best subsurface zener references such as the LTZ1000, utilizing specialized heating techniques.
Competitive Reference Measures 500 Times Worse Than Claimed
Long-term drift data was taken with parts that were soldered onto PC boards similar to a “real world” application. These boards were not preconditioned. They were placed into a constant temperature oven with TA = 30°C and their outputs were scanned regularly and measured with an 8.5 digit DVM. Figures 1 and 2 show typical long-term drift of the LT1461S8-2.5 and the SOT-23 LT1790S6-2.5. Initially, data was taken every hour where the largest changes occur, but after several hundred hours the frequency was lowered to reduce the large number of data points. Figure 3 shows long-term drift of a competitive reference that specifies long-term drift of 0.2ppm/kHr in its data sheet. Measured data shows this reference to have drift between 60ppm/ kHr and 150ppm/kHr or 300 to 750 times worse than claimed.
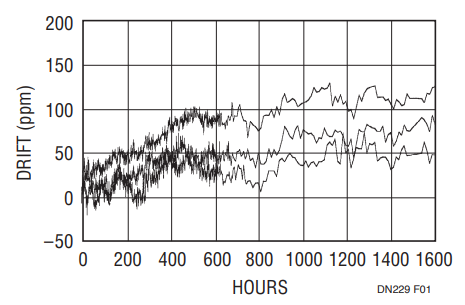
Figure 1. LT1461S8-2.5V Long-Term Drift.
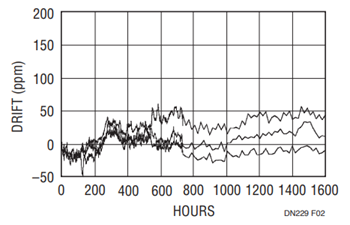
Figure 2. LT1790SOT23-2.5V Long-Term Drift.
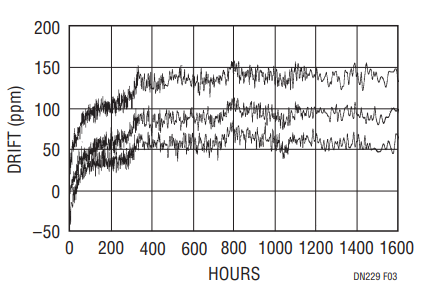
Figure 3. XXX291S8-2.5V Long-Term Drift.
Long-term drift can be reduced by preconditioning the PC board after the reference has been soldered onto the board. Operating the PC board at 25°C or elevated temperature stabilizes initial drifts. This “burn-in” of the PC board eliminates the output shift that occurs in the first several hundred hours of operation. Further changes in output voltage are typically logarithmic and changes after 1000 hours tend to be smaller than before that time. Because of this decreasing characteristic, long-term drift is specified in ppm/√kHr.
Hysteresis Limits Repeatability
When a reference is soldered onto a PC board, the elevated temperature and subsequent cooling cause stress that influences the output. If the voltage reference is repeatedly temperature cycled, inelastic stress is applied to the chip and the output voltage does not return to the 25°C initial value. The mechanical stress is due to the difference in thermal coefficients of expansion between the silicon chip, plastic package and PC board. This error, known as “thermally induced hysteresis,” is expressed in ppm and cannot be trimmed out because it is variable and has memory of previous temperature excursions. Hysteresis is always worse with higher temperature excursions, and differs with die attach and package type.
Hysteresis—Often the “Missing” Spec
Most manufacturers ignore hysteresis specifications, but they can be critical in precision designs. To graphically show hysteresis, many references were IR reflow soldered onto PC boards and the boards underwent a “heat soak” at 85°C (this ensures that they all had the same initializing temperature). The temperature was then cycled multiple times between 85°C, 25°C and –40°C and all 25°C output voltages were recorded. The stabilization time at each temperature was 30 minutes. The worst-case output voltage changes at 25°C are shown in Figures 4 and 5 for the LT1461S8-2.5 and the SOT-23 LT1790S6-2.5. A competitive reference, which makes no mention of hysteresis on its data sheet, was also measured and is shown in Figure 6.
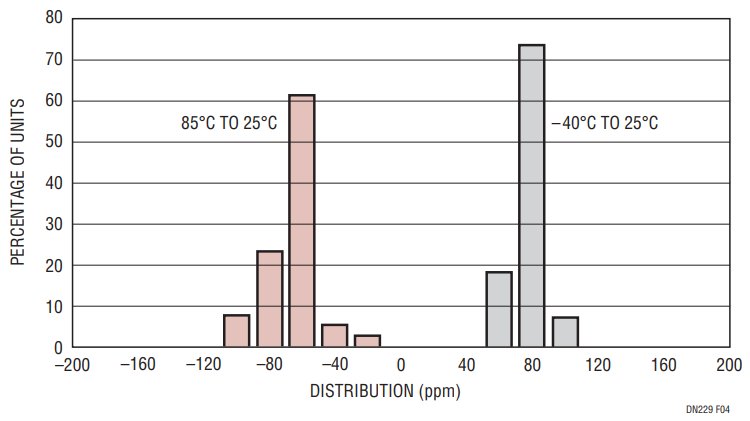
Figure 4. LT1461S8-2.5 Industrial Hysteresis.
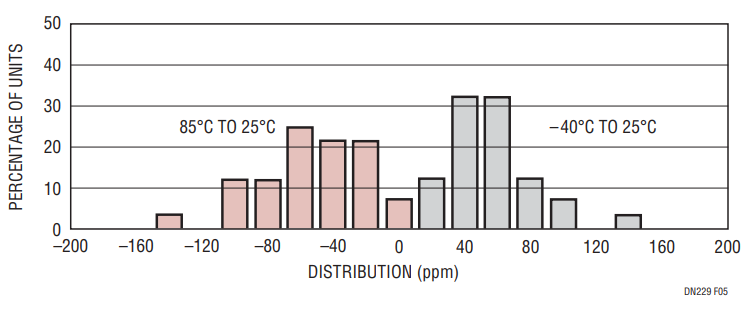
Figure 5. LT1790S6-2.5 Industrial Hysteresis.
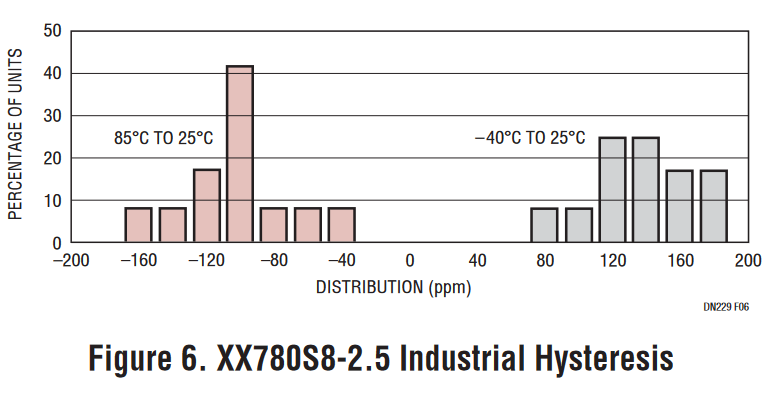
Figure 6. XX780S8-2.5 Industrial Hysteresis.
Conclusion
Voltage references from Linear Technology are conservatively and accurately specified, unlike those from other manufacturers that intentionally mislead or eliminate key specifications to cover shortcomings—shortcomings that may cause large errors.
The new LT1461 and LT1790 excel in all specifications that set system precision. There is nothing left out and there is nothing hidden.
