Abstract
This application note describes a step-by-step process covering how to export the logged temperature data from a Thermochron™ logger using the iButton® Viewer. This data is then imported into a Microsoft™ Excel spreadsheet to generate printable graphs. A working knowledge of the iButton Viewer and Microsoft Excel is required. The iButton Viewer is a free utility with the TMEX runtime environment.
Introduction
This application note describes the process of exporting the logged temperature data from a Thermochron logger using the iButton Viewer. This data is then imported into a Microsoft Excel spreadsheet to generate printable graphs.
A working knowledge of the iButton Viewer and Microsoft Excel is required. The iButton Viewer is a free utility with the TMEX runtime environment available here.
Procedure
- Start the iButton Viewer and place a Thermochron iButton in the receptor.
- Select the Thermochron ROM ID number from the device list.
- Open the Thermochron sub-viewer and select the "Mission Results" tab.
- If a mission is active, then the data will automatically import. If the data does not import, then select the "Read Data" button to gather the data from the Thermochron.
- Select either "Fahrenheit" or "Celsius" from under the "Options" drop-down menu.
- Ensure that "Show F/C on Temperatures" in the "Options" drop-down menu is not checked.


Data Format
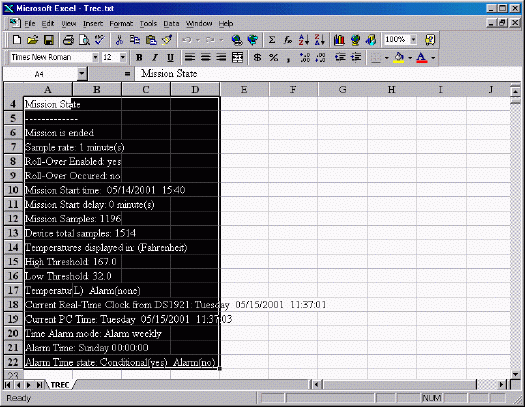
The first two rows of the imported data contain the ROM ID number and the time the information was downloaded from the Thermochron logger.

The following data section lists the Mission State information. This contains the settings that were decided set when the mission was started and the current state. Note that this information could have been skipped by setting the "Start Import at row" option in step 11 of the procedure.

Any temperature alarms generated during the mission will be listed in the next section, followed by the Temperature Histogram section and finally the Log Data section. In this example the "Log Data" will be graphed.
Graphing
To create a graph, select the "Log Data" to be graphed. Select both the time and temperature columns.

Next select "Chart" from the menu under "Insert".

From the Chart Wizard, select the type of chart that is required. Typically the "Line" chart works well with "Log Data".

A sample of the graph will be shown. This allows the data range to be checked and set.

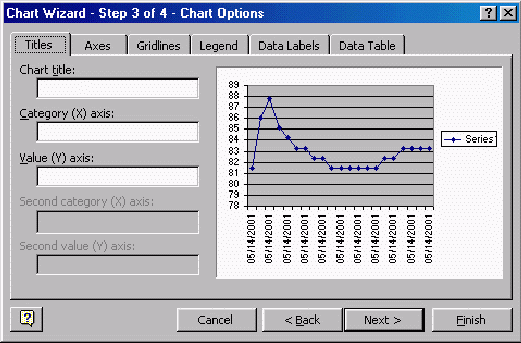
The next step of the Chart Wizard allows titles and labels to be added.

Finally, step 4 sets the placement of the graph in the spreadsheet.

If there are no other changes, click the "Finish" button to create the graph.


