LTspice: Integrating Noise Over a Bandwidth
LTspice can perform .noise analysis of a circuit, where the noise voltage density (V/√Hz) for 1Hz bandwidth) can easily be plotted for the output noise, input noise or for any noisy component like a resistor, diode or transistor. However, you can also easily integrate noise over a selected bandwidth in a .noise analysis.

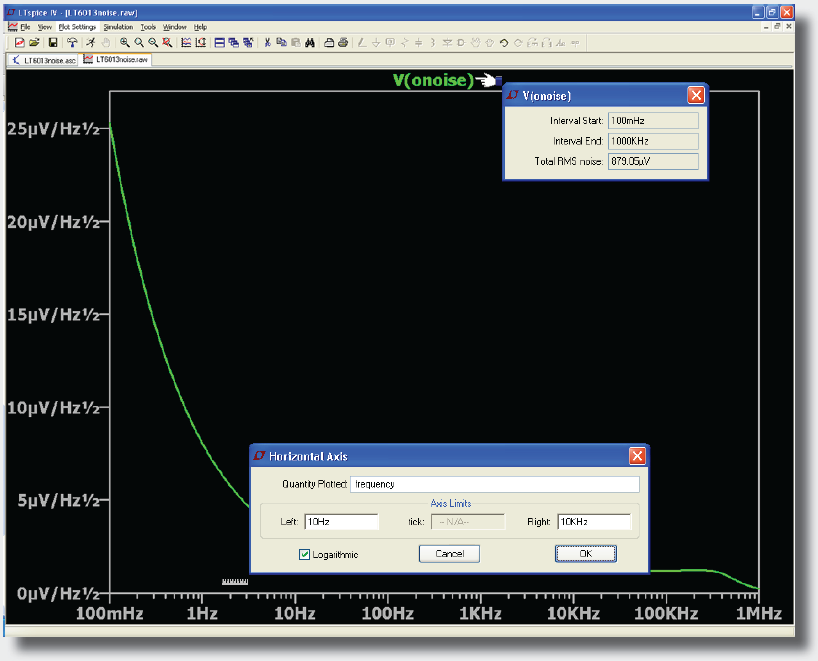
Figure 1. LTspice IV: Integrating Noise Over a Bandwidth.
To use this feature, Ctrl-click the data trace label, V(noise), in the waveform viewer—the total RMS noise based on the bandwidth specified in the .noise directive is displayed.
If you prefer to calculate the total noise over a limited bandwidth rather than the bandwidth specified in the .noise directive you can modify the left (low) and right (high) frequency limits of the waveform viewer by clicking on the horizontal axis. Once you have your waveform displaying the bandwidth of interest, Ctrl-click the data trace label to display the total RMS noise based in the bandwidth of interest.
Alternately, you can add a .measure statement to your schematic that will calculate the total noise over a particular bandwidth, and view your results in the LTspice error log (Ctrl + L) after each simulation. (More information on using .measure statement can be found in LTspice Help (F1).

Figure 2. LTspice IV: Integrating Noise Over a Bandwidth.


