A Bode Diagram to Display a Control Loop

2026-07-13

Figure 1


Key Takeaways

  • A passing load transient test doesn't guarantee your power supply is truly stable. Bode plots expose phase margin and hidden instability risks that time-domain tests simply cannot reveal.
  • Crossover frequency reveals your control loop's true response speed. Targeting between 1/10 and 1/5 of switching frequency optimizes performance—a critical metric only a Bode plot can clearly show.

Abstract

This article explains why Bode plots are used to showcase the transfer function of a power supply loop. While there are load transient tests in the time domain, the results do not show other important information that a Bode plot does. Readers will learn to understand such differences and why it is useful to calculate, simulate, and measure Bode plots.

Introduction

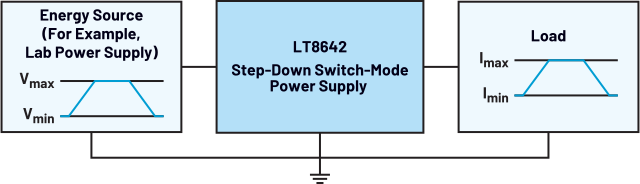
Power supplies are supposed to generate a stable regulated output voltage. To evaluate a power supply circuit, the output voltage can be measured at different load currents and at different input voltages and to assess whether the output voltage generated is within a desired tolerance range. Such a basic check of a power supply is important, but it only shows part of the truth. If the load current or a supply voltage changes during operation, the voltage generated should be maintained as well as possible. Figure 1 shows a block diagram of a power supply (the LT8642S) with a load transient and input voltage changes.

Figure 1. A power supply with a load transient and an input voltage change (line transient).

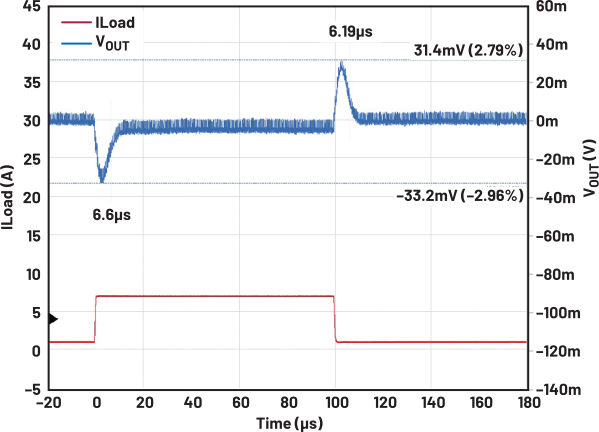
For a dynamic evaluation of a power supply, the output voltage generated can be checked at different load transients and different input voltage changes. Typically, there are curves of the output voltage as shown in Figure 2. The load current at the output of the power supply is changed from 1A to 7A current, within a 500ns transition time. The load transient can be seen in red. The output voltage curve is shown in blue. As shown, the output voltage generated drops by 33.2mV with a positive load transient at time zero. The control loop of the power supply then manages to stabilize the output voltage again after about 10μs. At the time of 100μs, a load transient from 7A back to 1A load current is made, as seen in Figure 2. The output voltage shows a short overshoot to a value that is about 31.4mV above the nominal output voltage.

Figure 2. Load transient test of a typical power supply measured with LTpowerAnalyzer<sup>TM</sup>hardware.
Figure 2. Load transient test of a typical power supply measured with LTpowerAnalyzerTM hardware.

Such an evaluation of a power supply control loop is useful and offers a lot of information on control behavior. However, these load transient measurements are often insufficient. For example, one does not get a clear statement as to whether the behavior of the output voltage curve is mainly determined by the size of the output capacitance, or by the speed of the control loop transfer function. A slow control loop can be partially compensated for with additional output capacitors.

Also, a load transient test does not provide clear information about the stability of a control loop. A measurement, as shown in Figure 2, can come from a control loop, which is barely stable and slips into instability with a slight parameter change, such as due to the tolerance range of components, temperature effects, and slightly altered operating conditions. Then the output voltage generated would no longer be kept at a fixed value, but would oscillate with a large amplitude.

However, the voltage curve in Figure 2 can also come from a power supply that offers a high stability margin. Here, slight changes in the circuit, as described in the previous case, would not lead to an oscillation.

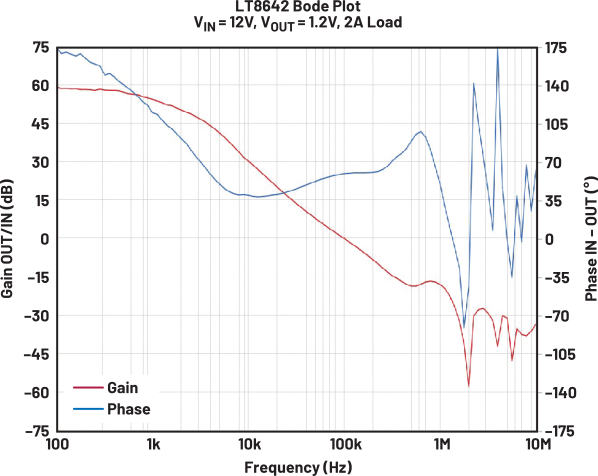
Figure 3 shows a measured Bode diagram of the power supply from Figure 1. Here, you can see the speed of the control loop from the point at which the gain, red curve, crosses the 0dB line. The higher this crossover frequency, the higher the speed of the control loop. Usually, a 0dB crossover frequency between one tenth and one fifth of the switching frequency is targeted. Figure 3 shows a crossover frequency of about 100kHz. In addition to this frequency, DC gain (the gain at low frequencies) also has an influence on the speed of the control loop. The higher this gain, the faster the control loop appears.

Figure 3. The representation of a Bode diagram for a detailed insight into the control loop behavior of a power supply.

In addition, a Bode diagram provides information on the stability margin of a power supply. At the frequency of the 0dB crossover, the phase offset, also known as the phase margin, can be read from the blue curve. In the example above, this phase margin is about 59°. Systems with a phase margin greater than 45° are considered to be stable.

Conclusion

Bode diagrams provide important information about the behavior of a control loop. The speed of the control loop can be displayed and compared with other power supplies. The stability of a power supply is also shown with an indication of the available margin. Neither of these valuable pieces of information can be read directly in a simple load transient test.

关于作者

Frederik Dostal
Frederik Dostal是一名拥有20多年行业经验的电源管理专家。他曾就读于德国埃尔兰根大学微电子学专业并于2001年加入National
添加至 myAnalog

将文章添加到 myAnalog 的资源部分、现有项目或新项目。

创建新项目

关联至此文章

产品

技术解决方案
产品分类
最新视频 25
Title
Subtitle
了解更多
添加至 myAnalog

将文章添加到 myAnalog 的资源部分、现有项目或新项目。

创建新项目