AN-1301: Using CDCs to Control Motion for Sample Aspiration
Introduction
In applications such as chemical analysis, transferring fluids from one vessel to another is necessary. Typical examples include in-vitro diagnostic systems and blood analyzers. Many of these systems must be capable of efficiently aspirating samples from cuvettes, or reagents from their bottles. Because these units are very often lab-based systems that process large numbers of samples, it is important to process the samples as quickly as possible. Therefore, the probes used for aspiration must move at high speed to minimize the impact of probe motion on the processing time. To move the probe efficiently, it is necessary to accurately determine the location of the probe in relation to the surface of the fluid being drawn. This application note demonstrates how a capacitance-to-digital converter (CDC) can be used to determine the probe location with a high level of confidence.
CDC Technology
At a basic level, a sigma-delta (Σ-Δ), analog-to-digital converter (ADC) uses a simple charge balancing circuit. A known reference voltage and an unknown input voltage are applied across the known on-chip, fixed input capacitors. The charge balancing circuit is then used to determine the unknown input. For a Σ-Δ based CDC, the unknown value is the input capacitor. When a known excitation voltage is applied to the input, the charge balancing circuit is then used to detect changes in the value of the unknown capacitor (see Figure 1). This arrangement retains the resolution and linearity of the Σ-Δ ADC.
There are many possible implementations for these integrated CDCs. Devices such as the AD7745 and the AD7746 operate as shown in Figure 1, where one electrode of the capacitor is connected to the excitation output, and the other electrode of the capacitor is connected to the CDC input. Other devices, such as the AD7747 (single electrode device), apply the excitation to the same electrode that reads the capacitance. In this case, the other electrode is a grounded one, which can be an actual electrode or a finger of the person using the application. Single electrode CDCs are the basis used for many of the touch screens in use today. Either type of CDC can be used to determine the probe location.

Figure 1. Basic CDC Architecture.
The Capacitor
In its simplest form, a capacitor can be described as two parallel plates with a dielectric material between them. The value of the capacitance varies with plate size, orientation of one plate vs. the other, and dielectric constant, among other factors. By using these variables, it is possible to measure the changing value of an unusual capacitor to determine the probe position relative to the surface of the fluid.
In an aspiration system, the capacitor is composed of a conductive plate that sits beneath the cuvette or other vessel and the moving probe itself (see Figure 2). Using a CDC like the AD7745, the excitation signal is applied to one electrode of the capacitor, and the other electrode of the capacitor is connected to the CDC input. The measured capacitance is the same, no matter which electrode is connected to the excitation signal or the CDC input. The absolute value of this capacitor depends on the form factors of the plate and the probe, the composition of the dielectric material, the distance from the probe to the plate, and environmental factors. Note that the dielectric material includes air, the cuvette, and the fluid contained in the cuvette. In an aspiration system, the changing nature of this dielectric mix is analyzed as the probe approaches the plate, and more importantly, as it approaches the fluid surface.

Figure 2. Use of a CDC to Determine the Probe Location Relative to a Fluid Surface.
As the probe approaches the plate, the capacitance increases. The nature of this change was observed to be a function of power series (quadratic). Figure 3 shows the capacitance as the probe approaches a dry cuvette. However, the coefficients in this power series change in the presence of fluid in the path of the probe. Because the fluid has a much greater dielectric constant than air, when the fluid becomes a higher percentage of the dielectric between the probe and the plate, the capacitance increases more rapidly. When the probe approaches the surface of the fluid, the measured capacitance value accelerates (see Figure 4). This acceleration can help to determine the proximity of the probe to the surface of the fluid.
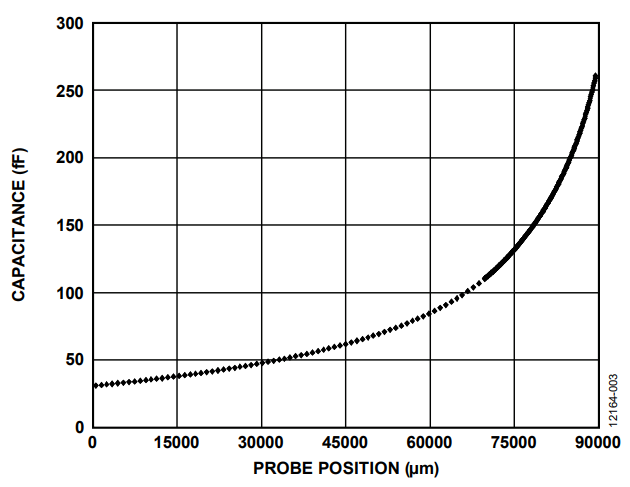
Figure 3. Capacitance Measurements with Dry Cuvette.

Figure 4. Capacitance Measurements with Filled Cuvette.
Normalizing Data
The difference in the curves, shown in Figure 3 and Figure 4, indicates how to make the measurements even more reliable in terms of determining the fluid level. If the probe location with respect to a given reference point is accurately known, the system can be characterized at various points with no fluid present. Such characterization generates a curve similar to the one shown in Figure 3. With this characterization data available, it is possible to normalize the data collected while the probe approaches the fluid surface. Normalization can be accomplished by simply subtracting the dry characterization data from the approach data, as shown in Figure 5.
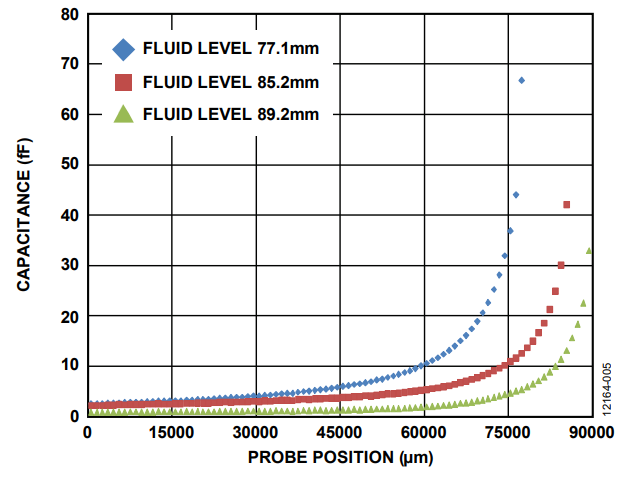
Figure 5. Normalized Capacitance Measurements.
Excluding changes in environmental factors (temperature, humidity, and so on), normalization removes the effects of the systematic factors on the capacitance measurement. Electrode size, distance from the probe to the plate, and the dielectric effects of air and the cuvette itself (if used in the dry characterization), are removed from the measurement. Essentially, the data now represents the effect of adding the fluid to the dielectric mix. By analyzing the approach technique, it is clear that normalized data, such as that shown in Figure 5, can make control of the approach easier and more consistent.
However, normalized data cannot always be used. For instance, the motion control system may not be precise enough to determine the accurate position. It is also possible that the communications link with the motor controller is relatively slow with respect to the output rate of the CDC. However, even if it is not possible to use normalized data, the methodology described later in this application note still works well. Most testing performed in the Analog Devices, Inc., lab did not use such data.
Using Slope and Discontinuities
As previously shown in Figure 4 and Figure 5, the measured capacitance value accelerates as the probe approaches the fluid surface. It should be possible to use this information to control the probe speed as it gets closer to the surface, but it does not work out quite this easily. For instance, the raw capacitance measurement will be higher as it approaches the surface of a container when the fluid level is low, and will be lower when the level of fluid in the container is high. When using normalized data, the reverse is true. This fact makes it more difficult to find a threshold to trigger the best time to change the speed of the probe.
However, it is still possible to take advantage of the acceleration of the capacitance readings, by using the slope instead. By definition, the slope is the change in capacitance vs. the change in position. However, when moving the probe at a consistent speed, it is sufficient to mimic the slope by simply subtracting one capacitance reading from another. Figure 6 plots the slope for the same data used in Figure 5.
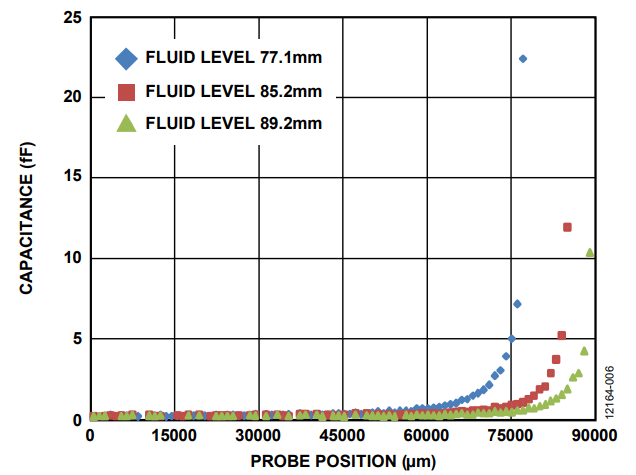
Figure 6. Slope (Normalized Capacitance).
The slope of the raw or normalized capacitance readings proves to be much more consistent for varying fluid levels than the readings themselves. It is relatively straightforward to find a slope threshold that works consistently, regardless of the fluid level. The slope data may show more random variation than the capacitance data; therefore, averaging can be helpful. The calculated slope remains in a small range for most of the travel of the probe, as shown in Figure 6. When the slope value breaks above this range, the probe is very near the fluid surface. This technique resulted in a very robust approach profile in the Analog Devices lab.
The behavior of the aspiration system as the probe approaches the fluid surface has been demonstrated. However, a key characteristic of this method becomes clear once the probe makes contact with the fluid. As shown in Figure 7, there is a large discontinuity at this point. This discontinuity is not a part of the normal acceleration of the capacitance curve. The capacitive reading taken at this point in the Analog Devices lab, was observed to be more than twice the reading taken before the probe was inserted into the fluid. This relationship may vary with a different system configuration, but has been observed to be stable and consistent. The size of the discontinuity makes it relatively easy to find a capacitance threshold that will reliably indicate that the fluid surface has been penetrated. Because one of the objectives of aspiration is to insert the probe a small, known distance into the fluid, this ease of use is important.

Figure 7. Discontinuity at Fluid Surface.
In aspiration systems, it is important to maximize the throughput by performing all probe motion at the highest possible speed, while minimizing the risk of damage from driving the probe too far (that is, through the bottom of the cuvette). A high precision motor control system may not always be available. Therefore, the solution must work even if the precise probe location is unknown. The measurements previously described allow this high speed probe motion with a high level of confidence.
The Method
Figure 8 shows a flow chart outlining the technique used to insert the probe into the fluid.
- The probe is moved at the highest possible speed until it gets close to the fluid surface. Depending on the positional information and computing power available, and the ability to characterize the system in advance, an optimum position can be determined using a capacitance threshold, by determining the slope of the capacitance curve and applying a slope threshold, or calculating a power series. This approach profile was developed in the Analog Devices lab by setting a threshold value for the slope of the capacitance readings. Averaging can be used to smooth the curve and make the determination more reliable. It was also observed that normalizing the capacitance data as previously described, if possible, results in a more robust system.
- Once it is determined that the probe has come close enough to the surface, the speed of the probe is greatly reduced for the final approach to the fluid surface. It is important that the probe is as close as possible to the fluid surface to maximize efficiency. However, it is important to verify that the approach speed is reduced sufficiently prior to penetration of the fluid surface. Reducing speed ensures maximum control of the probe depth.
- Contact with the fluid surface is determined by noting the discontinuity that occurs upon contact. The discontinuity can be determined using a capacitance threshold (as performed in the Analog Devices lab), or by determining the slope of the capacitance curve and applying a slope threshold. Averaging can be used to reduce random measurement variation. However, the shift is significant and can be detected reliably without the use of averaging. Normalization of the capacitance data, as previously described, can also be used to improve the robustness of surface detection, although its impact is not as significant as in the approach phase.
- The probe can then be driven a predetermined distance below the surface. Control of this movement is simple when precise motor control is available. If precise motor control is not available, but a speed estimate can be made, the probe can be moved for a fixed period.
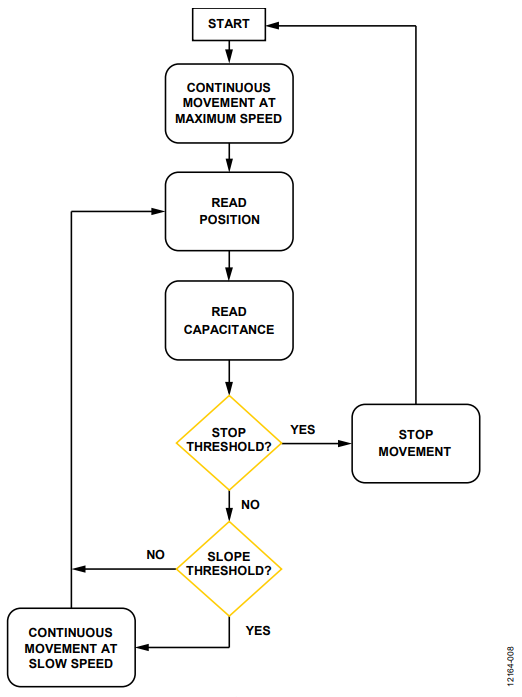
Figure 8. Simplified Motor Control Flow.
When the fluid is penetrated, two interesting characteristics of the capacitance reading are apparent. First, the measured value seems to change relatively little as the probe is moved through the fluid. A consistent change rate can, ideally, help to determine the penetration depth. However, such a change was not observed. Secondly, as shown in Figure 9, the measured value also varied very little for different levels of fluid within the vessel. The capacitance measured after barely penetrating the surface with a full vessel, and that measured with a nearly empty vessel, were essentially the same.

Figure 9. Capacitance vs. Fluid Level.
This flat response was true for the measurement of the raw capacitance value. However, by normalizing the data, as previously described, a difference was observed. As the fluid level decreased, the normalized capacitance value also decreased. This variation may be useful for helping to determine if the fluid level is getting low, in a situation where reliable position data is not available from the motion control system.
Once the fluid surface is penetrated, the time required to stop the probe is subject to multiple factors, including the motor control system itself. However, a carefully planned approach profile can ensure precise control of the probe penetration, while maximizing probe speed until the last moment. In the Analog Devices lab, a probe that moved approximately 0.45 mm between capacitance readings at maximum speed, was stopped within 0.25 mm of penetrating the surface. At a faster sampling rate, a probe moving approximately 0.085 mm between samples was stopped within 0.05 mm of the fluid surface. In both cases, the probe was operated at the maximum speed until within 1 mm to 3 mm of the fluid surface, allowing maximum efficiency and throughput.
Summary
This application note details a nontraditional use of an integrated CDC. The integrated CDC provides a simple solution, compared with many technologies, while still maintaining reliability. An approach profile was demonstrated using both capacitance and slope measurements to influence the motion control. Alternative implementations were also discussed that allowed greater reliability or additional information. The CDCbased solution consistently stopped the probe quickly after the surface was penetrated, while still allowing the maximum probe speed until the last moment.
However, this application note has only scratched the surface of using CDC technology for aspiration probe control. Engineers can use the approach outlined in this application note as a starting point for an improved solution and tailor this approach to their specific situation.
作者
