Introduction
Blood coagulation is a complex, dynamic physiological process by which clots are formed to end bleeding at an injured site. During heart-bypass surgery, blood is diverted out of the body to a heart-lung machine, which maintains heart- and lung functions. The machine is operated by a perfusionist, whose role includes monitoring appropriate parameters to ensure that the patient is effectively treated with an anticoagulant to avoid blood clots. For this purpose, heparin, an anticoagulant drug, is administered during surgery—followed by a rapid reversal afterwards to prevent excessive bleeding.1 To maintain the delicate balance between clotting and bleeding, the clotting time of the patient is monitored every 30 to 60 minutes during surgery and several times after surgery, until a normal clotting time is restored.2 Currently, blood samples taken from a patient’s intravenous line are tested at bedside, with measured clotting-time values used to adjust the anticoagulation therapy.
Analog Devices is a partner in the Biomedical Diagnostics Institute (BDI),3 a Centre for Science, Engineering, and Technology, funded by Science Foundation Ireland.4 BDI is a multidisciplinary research institute focused on the development of next-generation biomedical diagnostic devices. Under one of the BDI Integration Programs, Analog Devices is working with Dublin City University5 and a global specialty pharmaceutical and medication delivery company to develop a coagulation-monitoring device for patients undergoing treatment in the critical-care environment. This system will provide rapid, automated information on patient clotting status—improving patient safety, workflow, and decision support—leading to improvements in patient outcomes.
Electrical Measurement of Blood Coagulation
Blood coagulation in the body is modulated by a number of cellular and other active components. The coagulation cascade describes the components of blood and how they are involved in the process of clot formation. As the cascade becomes activated, the blood progresses from a nonclotting to a clotting state, causing changes in both molecular charge states and effective charge mobility. The final steps of the cascade involve two components, thrombin and fibrinogen. Thrombin acts by cutting the fibrinogen, forming fibrin filaments—which spontaneously aggregate. The endpoint of clotting time has been defined as the time at which a fibrin clot is formed.6,7
By monitoring the global impedance of a clotting blood sample, the changes in conductivity associated with clot formation are measured. To evaluate instrument performance, the clotting time determined from the data was correlated to a “gold-standard” clinical measurement of clotting time.
Impedance Measurement Using the AD5933
The AD59338 fully integrated single-chip impedance analyzer (Figure 1) is a high-precision impedance-converter system that combines an on-board frequency generator with a 12-bit, 1 MSPS, analog-to-digital converter (ADC). The frequency generator provides an excitation voltage to an external complex impedance at a known frequency. The response signal (current) is sampled by the on-board ADC, and a discrete Fourier transform (DFT) is processed by an on-board DSP engine. The DFT algorithm returns real (R) and imaginary (I) data-words at each output frequency. Using these components, the magnitude and relative phase of the impedance at each frequency point along the sweep can be easily calculated.
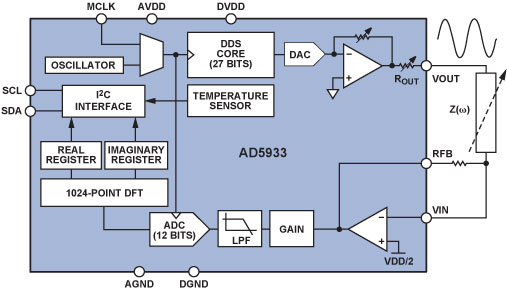
The block diagram of the AD5933 demonstrates the full integration of the impedance-measurement system. Local digital processing enables the calculation of the complex impedance of the circuit under test. The system requires initial calibration: a precision resistor is substituted for the impedance to be measured; and a scaling factor is calculated for subsequent measurements. The AD5933 can measure impedance values between 100 Ω and 10 MΩ to a system accuracy of 0.5% for excitation frequencies from 1 kHz to 100 kHz.
The correlation of blood clotting with impedance changes has long been established in the literature.9,10,11,12,13 However, the recent availability of integrated-circuit complex-impedance measuring devices means that the blood clotting time measurement instrument can be miniaturized. This offers significant advantages in terms of power savings, portability, and final instrument footprint, a key consideration in the critical-care setting.
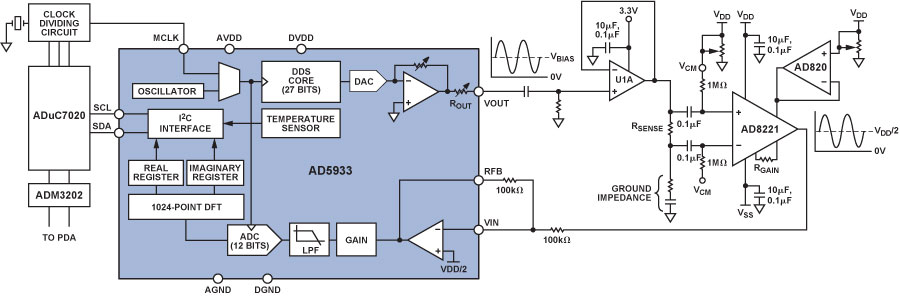
Single-supply devices, such as the AD5933, often center signal swings around a fixed value of dc bias. This is not an important consideration in most impedance measurements, but dc voltages above a specific threshold cause electrochemical processes to take place in aqueous conducting media in contact with electrodes, altering the sample. To prevent this electrolysis from occurring in blood-sample measurements with the AD5933 in the current project, the voltage excitation and the current measurement were ac-coupled using the signal conditioning circuit shown in Figure 2.
The Blood-Coagulation Measurement System
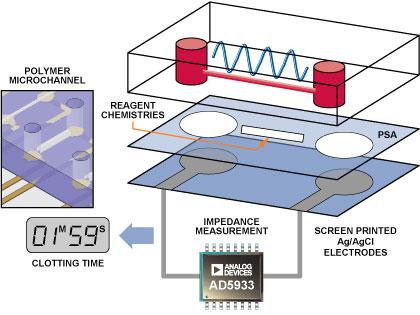
The interface between the blood-sample delivery and the measurement instrumentation is critical. In this case, a specific microfluidic channel into which the blood sample was delivered was designed to connect to the AD5933 instrumentation circuit (Figure 3). The microfluidic device consists of three layers. The bottom layer comprises two screen printed electrodes, which were connected to the input/output port pins of the AD5933 circuit. The top micromolded polymer channel consists of two reservoirs connected via a microchannel. The chemical reagents that modulate the clotting reaction can be contained either within this microchannel or on the central bonding layer. The top- and bottom channels are bonded using a pressure-sensitive adhesive (PSA). The blood sample applied to one reservoir filled the microchannel. This was contacted by the screen-printed electrodes, which were in turn interfaced to the AD5933 circuit.
Measured Impedance Responses
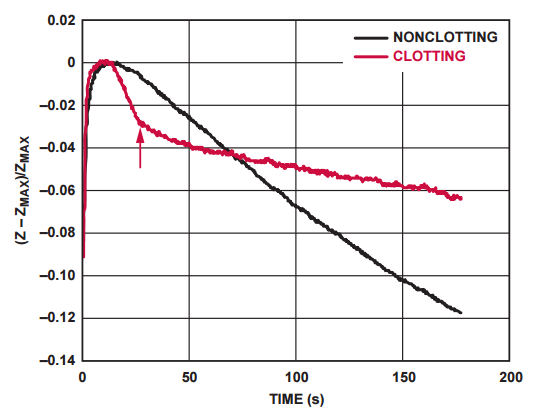
Impedance response curves of a clotting and nonclotting blood sample are compared in Figure 4. The arrow on the figure indicates the point at which the clotting time of the sample is established.
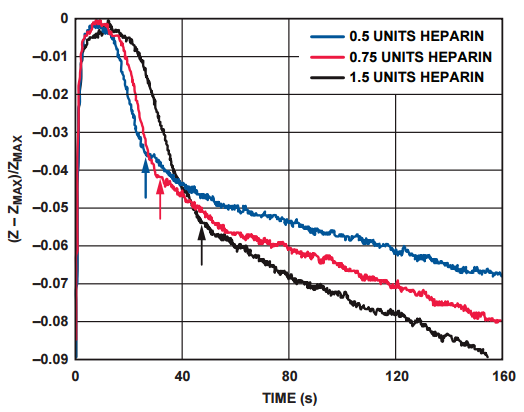
The impedance response of Figure 5 shows the increase in clotting time with increasing concentrations of heparin in the blood sample. The arrows indicate the clotting time of the different samples.
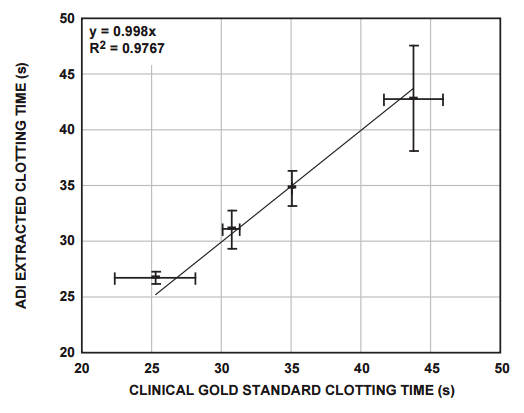
The clotting times of a number of clinically relevant blood donor samples were measured using the system described above, and these were correlated with measurements performed on the sample donor samples, using the clinical gold-standard measurement system (Figure 6).
Conclusion
The AD5933 single-chip impedance analyzer has been successfully applied to the measurement of blood-impedance changes during coagulation. It offers flexibility, power, and size advantages to the end user over the existing commercially available solutions. Combining integrated-circuit technologies of this sort with new technologies in other media, such as microfluidics and sample handling, provides a powerful platform for future medical device research and development.
References
1Bowers, John and James J. Ferguson. “Use of the Activated Clotting Time in Anticoagulation Monitoring of Intravascular Procedures.” Texas Heart Institute Journal. 20 (4). 1993. 258–263.
2Kost, Gerald, J., ed. Principles and Practice of Point-of-Care Testing. Lippincott, Williams and Wilkins. 2002.
3www.bdi.ie
4www.sfi.ie
5www.dcu.ie
6Guest, M.M. “Circulatory Effects of Blood Clotting, Fibrinolysis, and Related Hemostatic Processes.” Handbook of Physiology, Circulation III, American Physiological Society. Washington, DC. 1964.
7Brummel-Siedins, K., T. Orfeo, Jenny N. Swords, S.J. Everse, and K.G. Mann. “Blood Coagulation and Fibrinolysis.” Chapter 21 in Wintrobe’s Clinical Hematology. 11th edition. Volume 1. M.M. Wintrobe and J.P. Greer, eds. Lippincott, Williams, and Wilkins. 2004.
8ADI website: www.analog.com (Search) AD5933 (Go)
9Ur, A. “Changes in the electrical impedance of blood during coagulation.” Nature 226. 1970a. 269–270.
10Ur, A. “Determination of blood coagulation using impedance measurements.” Biomedical Engineering 5 (7). 1970b. 342–345.
11Ur, A. “Detection of clot retraction through changes of the electrical impedance of blood during coagulation.” American Journal of Clinical Pathology 56 (6). 1971. 713–717.
12Ur, A. “Analysis and interpretation of the impedance blood coagulation curve.” American Journal of Clinical Pathology 67 (5). 1977. 470–476.
13Theiss, W. and A. Ulmer. “Comparative and direct measurement of the electrical impedance in blood coagulation.” Thrombosis Research 13. 1978. 751–765.
Acknowledgements
The material in this article is based upon work supported by the Science Foundation Ireland under Grant No. 05/CE3/B754. Thanks to Dermot Kenny, Gerardene Meade, Sarah O’Neill, and all at the Department of Molecular and Cellular Therapeutics at Royal College of Surgeons in Ireland for provision of facilities and expertise. Thanks to Nigel Kent for the microfabrication work—and to the Coagulation Monitor research team at the Biomedical Diagnostics Institute, DCU, Dublin, led by Principal Investigator, Dr. Tony Killard.